
Heat Map Analysis in Video Analytics: Transforming Invisible Data into Visual Intelligence
- August 26, 2025
- Posted by:
- Category: Articles
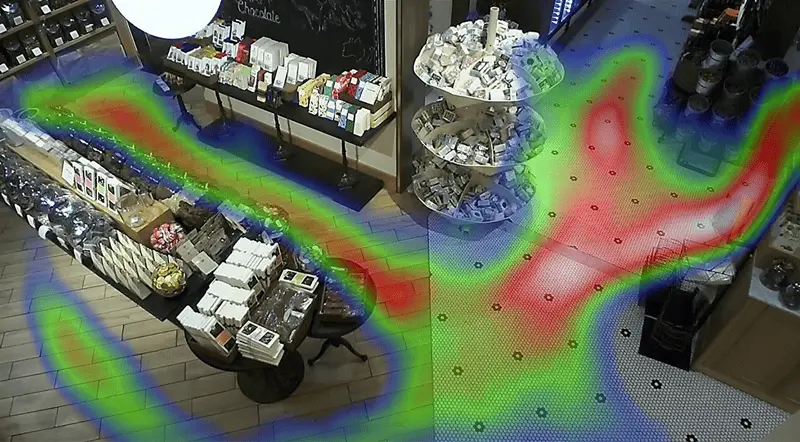
Companies and organizations worldwide require heat map analysis in video analytics. Why? They reflect patterns of movement and interaction within various spaces, ranging from retail sectors to stadiums, banks, industrial facilities, and even healthcare facilities. When a heat map is combined with artificial intelligence and video analytics platforms, organizations and companies can transform invisible data into visual intelligence. This helps make more accurate decisions across all industries and directly impacts operational flow and achieving results and objectives.
Entities should not delay in adopting heat map analysis technology, and that’s why: the heat map software market reached approximately $1.2 billion in 2024 and is expected to reach $3.5 billion by 2033, with a compound annual growth rate of 12.5% between 2026 and 2033 (Verified Market Reports, 2025). This reflects the fast spread of the technology and its increasing global adoption, meaning that the faster institutions adopt it, the more steps ahead they will be of their market competitors.
What Does Heat Map Analysis in Video Analytics Mean?
Heat maps analysis in video analytics is a graphical representation of data using colors, and is used to illustrate:
- Movement of people or vehicles.
- Duration of stops in specific locations.
- Preferred paths taken by visitors or passengers.
- Crowded areas and idle points.
Heat maps technology makes it easy to monitor the most active areas and least used areas, providing direct insights into human behavior or traffic flow within a facility or company.
Color Scale in Heat Maps:
- Red/Yellow: High activity (hot zone).
- Green/Blue: Low activity (cold zone).
This visual color representation enables business owners and operations managers to analyze complex data quickly and effectively. Companies, urban planners, and security experts can also benefit from the heat maps analysis insights to improve traffic flow, enhance security, and increase operational efficiency.
How Does Heat Map Analysis in Video Analytics Work?
Heat map analysis in video analytics systems is based on four fundamental steps:
- Data Collection: Through surveillance cameras or Internet of Things (IoT) devices distributed in strategic locations such as stores, stadiums, or train stations.
- Object Recognition and Tracking: Using computer vision algorithms and deep learning to differentiate between people, vehicles, and moving elements.
- Data Conversion to Maps: Through processing dwell time and timestamps, where areas are colored according to usage density.
- Real-time Analysis and Trend Tracking: To monitor peaks and long-term patterns such as recurring bottlenecks or sudden behavioral changes.
Practical Applications of Heat Map Analysis in Video Analytics
Heat map analysis in video analytics has wide applications across multiple fields, including:
1. Retail Sector and Shopping Centers
- Optimizing product display locations according to customer paths.
- Reducing congestion at checkout counters.
- Supporting marketing campaigns by targeting long-stay areas.
- Understanding how audiences move within the space and areas that no one visits.
2. Banks and Financial Institutions
- Designing branches according to customer flow patterns.
- Managing queues effectively and distributing staff.
- Predicting peak hours to allocate resources efficiently.
3. Stadiums and Major Events
- Preventing bottlenecks before they occur through crowd movement analysis.
- Increasing profits from kiosks and restaurants by placing them in natural movement paths.
- Improving evacuation plans through historical data of movement patterns.
4. Public Transportation and Train Stations
- Detecting crowded areas during peak hours.
- Redirecting passengers through dynamic signage.
- Improving trip schedules based on actual demand rather than estimates and assumptions.
5. Urban Planning and Smart Cities
- Improving infrastructure for pedestrians, bicycles, and vehicles.
- Moving bus stops and distributing traffic signals according to actual movement.
- Utilizing public spaces such as parks and squares more efficiently.
6. Restaurants and Cafes
- Redesigning tables in line with customer flow and seating locations.
- Reducing order queues through smart counter distribution.
- Analyzing indoor and outdoor seating preferences according to conditions and understanding customer choices.
7. Security and Crowd Management
- Monitoring any dangerous gatherings and predicting the possibility of stampede situations before they occur.
- Detecting abnormal behaviors such as sudden stops or unusual movement.
- Supporting security teams in immediate response and crowd control, especially in public places and gatherings.
Also you can learn more about: Heatmap Analytics
AvidRetail from AvidBeam: What Organizations Look for in Heat Map Analysis in Video Analytics
AvidRetail can be summarized as the solution that provides store owners/institutions/banks/companies with intelligent information related to business operations, such as customer count, gender, age, distribution, and density analysis, through dashboards and marketing charts.
It is an AI-powered video analytics solution that works in real-time and easily extracts business operations-related information from surveillance cameras within institutions or organizations.
AvidRetail Features
- Visitor flow tracking and distribution
- Visitor entry/exit counting (daily/weekly/monthly)
- Identifying hot spots (most visited places by customers)
- Visitor distribution by gender
- Density analysis according to times of day
- Tracking movement patterns within the store
- Estimating visitor age distribution
- Various customizable alerts
- Traffic predictions based on historical data
- Cashier queue performance measurement according to times of day
- Graphical data representation
Technical Infrastructure of AvidRetail
- A minimum CPU (Central Processing Unit) clock speed of 2.4 GHz is required for smooth system operation.
- Multiple GPU (Graphics Processing Unit) configurations are supported to enhance computer vision algorithm performance.
- Scalable hardware options allow organizations to match processing power with analytical demands.
- Optimized architecture balances computational efficiency with real-time processing capabilities.
Camera System Compatibility
- Resolution support ranges from basic 2-megapixel cameras to advanced 4K systems.
- Lens focal length compatibility spans 3mm to 25mm for diverse monitoring scenarios.
Deployment and Positioning Options
- Pitch angle tolerance: -15° to +15° for vertical positioning flexibility.
- Roll positioning: Complete 360-degree rotation from -180° to +180°.
- Yaw adjustment range: -15° to +15° for horizontal fine-tuning.
- Generous positioning tolerances ensure optimal coverage regardless of architectural constraints.
Key Takeaways
- Heat map analysis in video analytics transforms movement patterns into color-coded visual data (red/yellow for high activity, green/blue for low activity) for quick decision-making.
- Uses computer vision algorithms and deep learning to track people and vehicles, processing dwell time and timestamps for accurate insights.
- Applicable across retail solutions, banking, stadiums, transportation, urban planning, hospitality, and security sectors for optimizing operations.
- AvidRetail‘s solution tracks visitor demographics, flow patterns, and density analysis, and provides predictive forecasting with customizable alerts.
- Heat map analysis in video analytics enables data-driven resource allocation, queue management, space optimization, and peak hour predictions across industries.
- Early adoption provides market advantages through improved customer experience, optimized layouts, and enhanced operational performance.
Also you can learn more about: AI for Video Analysis
1 Comment
Comments are closed.
[…] Learn more about: Heat map analysis in Video Analytics […]