How Businesses Use Heatmap Analytics to Understand User Behavior
- June 29, 2025
- Posted by:
- Category: Articles
Modern businesses face an invisible challenge when ignoring heatmap analytics. Customers walk through stores and organizations daily, yet their true behavior remains hidden. Traditional methods of understanding shoppers and visitors rely on basic sales numbers, traffic, and surveillance cameras showing people coming and going. And this basic approach leaves massive gaps in knowledge.
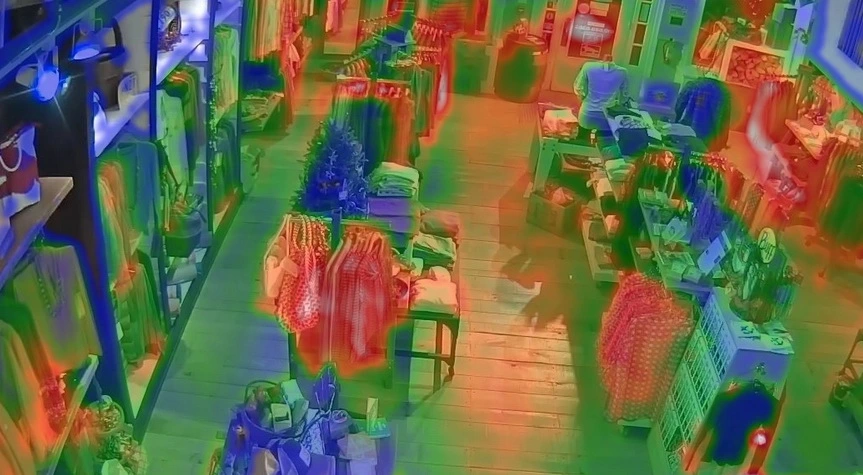
To overcome these gaps, businesses are turning to heatmap analytics for real-time, visual insights. By visualizing foot traffic patterns through color-coded data representations, organizations gain unprecedented insights into shopping behavior (priceless data and insights).
Understanding Heatmap Analytics
Heatmap analytics tech operates on sophisticated data visualization principles: advanced sensors capture customer/visitor movements throughout spaces. AI-powered video analytics devices track various metrics, including dwell time, product/employee interaction, and navigation paths.
The technology processes this raw data through complex algorithms and software converts movement patterns into visual representations, where colors indicate activity intensity. Red zones typically show high traffic areas, while blue sections represent quieter spaces.
|
Without sacrificing privacy, AvidBeam’s AI-based software technologies enable continuous tracking of customers’ and visitors’ behavior. Its strong Video Analysis AI engines use the gathered data to produce insights in real time.
Key components of heatmap technology include:
- Video analytics with AI-powered processing.
- Mobile device tracking for deeper insights.
- IoT integration for seamless data collection.
Heatmap Analytics and Navigation Patterns
Taking retail stores for example, when retailers use heatmap analytics to study customer movements, they find interesting patterns. The majority of customers move along typical routes, and knowing these routes helps in improving product placement and store design.
Heatmap data shows which sections are neglected and which areas draw attention, plus where clients spend the most time exploring. Depending on this, high-margin products are moved into desirable areas. Moreover, analysis of traffic flow reveals bottlenecks that frustrate customers. Congestion is frequently caused by narrow aisles or badly placed displays.
AvidBeam’s video analytics platform identifies all these problem areas instantly, allowing quick solutions. Customer journey mapping becomes precise with heatmap technology, and retailers can track complete shopping experiences from entrance to checkout.
But these capabilities are not limited to retail. Here is how:
- In hospitals, heatmaps guide patient flow and improve emergency room layouts.
- Banks use them to monitor visitor behavior and optimize teller placement.
- Railway stations and stadiums can benefit from enhancing crowd control and emergency planning.
- Smart cities analyze urban foot traffic using heatmap data-driven tools.
Strategic Placement Using Heatmap Analytics
In heatmap analytics, cold zones may present unique opportunities for creative merchandising, reorganizing, or team redistribution.
For instance, products typically overlooked in quiet areas can benefit from strategic promotional displays, and eye-catching presentations in these locations often positively surprise customers. In contrast, seasonal merchandise requires dynamic placement strategies. Heatmap data helps retailers adjust product locations based on changing traffic patterns: holiday decorations, summer gear, and back-to-school items perform better with data-driven positioning.
Similarly, in hospitals and clinics, cold zones might highlight confusing signage or underused service counters, helping facility managers redesign for better flow. In smart office buildings, analytics can suggest ideal zones for communal areas, elevators, or self-service kiosks.
Enhancing Layout Design with Heatmap Analytics
As heatmap analytics reveals how current place designs perform in practice, it can guide employers/owners to adjust the layouts for maximum benefits, especially the entrance (first thing to welcome the customer) and the checkout/exit door (the place’s aftertaste).
- Entrance areas require special attention since they create first impressions.
- Check-in and Checkout optimization is more effective using data-driven methods with heatmap analytics that reveal peak congestion times and problematic queue formations (in stores, railway stations, stadiums, and even banks). AvidBeam’s solutions help design efficient entry points, security checks, and exit routes that reduce waiting times.
Staffing Optimization Through Traffic Analysis
Employee deployment in stores becomes scientific with heatmap data. Using the tech, retailers identify when and where customers need assistance most frequently, enabling optimal staff scheduling and positioning strategies.
Customer service quality in stadiums improves when staff positions align with traffic patterns. Placing knowledgeable employees in high-interaction zones enhances experiences. This has also proven valuable in banks, where branch managers use footfall analytics to plan staffing during peak hours.
Also you can learn more about: AI Cameras
AvidRetail: Intelligence Through Heatmap Analytics
AvidRetail, powered by AvidBeam’s advanced solutions, turns physical spaces into intelligent environments where movement patterns become actionable insights. These spaces can be retail stores, banks, stadiums, railway stations, smart buildings, healthcare facilities, or public events, AvidRetail transforms spaces into data-driven intelligence centers.
Customer Intelligence
- Visitor counting tracks daily, weekly, and monthly traffic patterns.
- Demographics analysis reveals age and gender distributions.
- Customer flow mapping shows movement patterns throughout the space.
- Conversion rate tracking identifies how many visitors become buyers or achieve desired outcomes.
- Unique visitor identification prevents duplicate counting.
Operational Analytics
- Heat map visualization highlights the busiest areas across different environments.
- Visit the pathway analysis track movement journey patterns.
- Queue management monitors wait times at service points, ticket counters, or checkouts.
- Occupancy control manages space capacity limits.
- Parking detection identifies available spaces.
Predictive Intelligence
- Traffic forecasting uses historical data to predict busy periods.
- Staff allocation recommendations based on expected visitor volume.
- Rush hour identification and pinpoints peak activity times.
- Seasonal pattern analysis reveals yearly trends.
Heatmap Analytics Applications Across Industries
Banks
- Heatmap analytics transform branch operations by understanding customer flow patterns.
- Optimize teller allocation and reduce wait times at service desks.
- Improve branch layout design based on traffic patterns.
- Monitor queue lengths at ATMs for better management.
- Identify peak service hours for better staffing decisions.
Stadiums
- Enhance fan experience through crowd flow management.
- Optimize concession stand operations and security monitoring.
- Track movement patterns during events to prevent bottlenecks.
- Optimize entry/exit routes for better crowd control.
- Improve emergency evacuation planning through data insights.
Railway Stations
- Monitor passenger flow through platforms, ticket counters, and waiting areas.
- Optimize train scheduling based on passenger density patterns.
- Improve platform safety through crowd management.
- Enhance overall station operations with real-time data.
- Track peak travel times for better resource allocation.
Smart Buildings
- Create intelligent office environments by tracking space utilization.
- Optimize HVAC systems based on occupancy patterns.
- Improve workplace layout design through movement analysis.
- Monitor conference room usage and availability.
- Track common area traffic for better facility management.
Smart Cities (Retail Areas)
- Analyze pedestrian flow in commercial districts.
- Optimize public transportation routes based on foot traffic.
- Enhance urban planning decisions with movement data.
- Monitor foot traffic patterns to improve city services.
- Optimize public space utilization through analytics.
Hospitals/Healthcare
- Improve patient flow through waiting areas and departments.
- Optimize staff allocation in different healthcare departments.
- Enhance emergency response capabilities with real-time data.
- Monitor queue management at registration desks.
- Reduce patient wait times at pharmacy counters.
Public Events
- Manage crowd safety at concerts, festivals, and conferences.
- Track attendee movement patterns to prevent overcrowding.
- Optimize vendor placement based on foot traffic data.
- Improve overall event experience through data-driven insights.
- Monitor entry and exit flows for better crowd control.
Cafes and Restaurants
- Optimize table layout and seating arrangements based on customer flow.
- Monitor peak dining hours for better staff scheduling.
- Track customer dwell time to improve service efficiency.
- Analyze queue patterns at ordering counters and cashiers.
- Improve customer experience by reducing wait times.
- Monitor outdoor seating area utilization and preferences.
Technical Requirements for AvidRetail
Camera Specifications
- Resolution range: 2 megapixels up to 4K support.
- Lens compatibility: 3mm to 25mm focal lengths.
- Day/night operation maintains accuracy in varying light conditions.
- ONVIF compliance ensures compatibility with existing systems.
Hardware Needs
- Processing power: One virtual core per camera.
- Memory allocation: 2GB RAM per camera stream.
- CPU minimum: 2.4 GHz processor speed.
- GPU support: Various graphics card types accepted.
Installation Flexibility
- Camera positioning: Pitch -15° to +15°, Roll -180° to +180°, Yaw -15° to +15°.
- Lighting requirements: Normal lighting conditions, avoid backlighting.
- Storage efficiency: 150KB-200KB per database record.
- Data retention: Built-in policies manage storage duration.
Why Choose AvidRetail?
1. Deployment Versatility
AvidRetail adapts to diverse infrastructure needs. Edge processing, data center deployment, or hybrid configurations provide installation flexibility across various environments.
2. Integration Capabilities
- VMS compatibility works with Milestone and Genetec systems.
- Standalone operation functions independently when needed.
- Cloud deployment supports on-premise, private, or public cloud.
- High availability includes failover and redundancy features.
3. Scalability Advantages
The platform grows with the business. Adding cameras requires minimal configuration changes. Automatic scaling handles traffic spikes without manual intervention.
4. Cost Efficiency
Minimal storage requirements reduce infrastructure costs. Advanced algorithms optimize processing power usage across CPU (Central Processing Unit) and GPU (Graphics Processing Unit) resources.
5. Business Impact
Analytics previously available only to e-commerce now serve physical spaces across industries. Measure operational efficiency, improve service delivery, and optimize performance through data-driven decisions.
Also you can learn more about: Crowd Detection
Key Takeaways
- Traditional methods leave massive knowledge gaps about visitor behavior patterns across all industries.
- Heatmap analytics transforms guesswork into data-driven decision-making for any physical space.
- AI-powered sensors capture movement without compromising individual privacy.
- Navigation patterns follow predictable routes that optimize space utilization strategies.
- Strategic positioning of services and resources in traffic hotspots maximizes operational efficiency.
- AvidRetail bridges online analytics capabilities with physical space intelligence systems.
- Queue management systems reduce wait times and improve service efficiency across all sectors.
- Predictive analytics forecasts busy periods for proactive resource allocation and operational planning.
3 Comments
Comments are closed.
[…] Also you can learn more about: Heatmap Analytics […]
[…] previously mentioned, the video heatmap analytics market is expanding over time as organizations and companies in various industries realize the […]
[…] Also you can learn more about: Heatmap Analytics […]