
Applying Heat Map Analysis to Crowd Management and Security
- August 17, 2025
- Posted by:
- Category: Articles
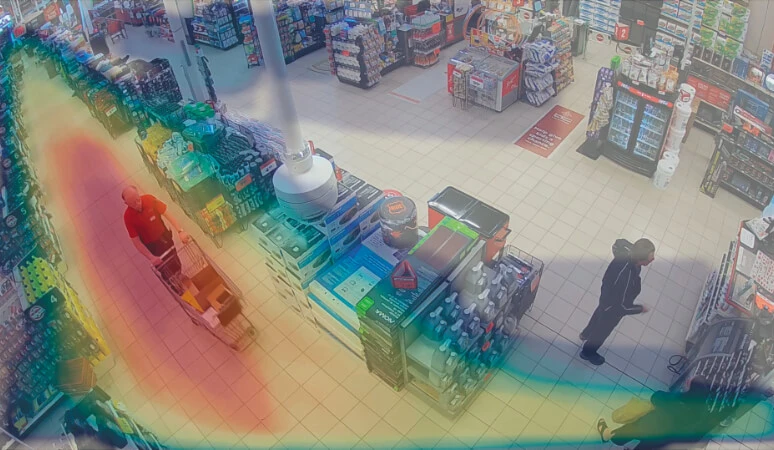
Businesses lose millions of dollars every year. Why? Because organizations ignore understanding people’s movement in their spaces, or at the very least, they don’t realize the importance of heat map analysis.
Traditional security cameras record everything but reveal nothing, and Heat map analysis changes this reality. The advanced video analytics server-based solution now converts invisible foot traffic into visual intelligence that drives better decisions across industries.
Heatmap software market size is estimated to be USD 1.2 billion in 2024 and is expected to reach USD 3.5 billion by 2033 at a CAGR of 12.5% from 2026 to 2033 (Verified Market Reports, 2025). |
How Heatmap Analysis Works
Surveillance cameras capture movement patterns across any space, and then the magic happens in the powerful video analytics solutions that process this raw data through AI algorithms.
- Unlike basic surveillance that simply stores footage, these server-based systems analyze behavior in real-time.
- Computer vision algorithms run on both CPU (Central Processing Unit) and GPU (Graphics Processing Unit) platforms, creating instant insights from multiple camera feeds at the same time.
Heatmap calculations primarily take into account timestamps and dwell time.
Elements | Description |
Timestamp | The timestamp indicates the date and time when an event occurred. |
Dwell Time | Dwell time refers to the duration an individual enters and remains within a tracking area for more than one second (configurable default threshold). The longer the dwell time, the more intense the colors on the heatmap. |
Reading the Heatmap Color-Coded Intelligence
Colors tell the whole story as red zones burn with high activity while blue areas stay cool and underused.
- Hot Zones (Red/Orange): Maximum visitor engagement and heavy traffic concentration.
- Warm Areas (Yellow/Green): Steady activity with consistent human presence.
- Cold Spots (Blue/Purple): Minimal engagement, presenting optimization opportunities.
Real-World Heat map Analysis Applications That Drive Results
As previously mentioned, the video heatmap analytics market is expanding over time as organizations and companies in various industries realize the importance of understanding audience/employee/population movement and its impact on overall performance improvement.
Banking Institution Optimization
Financial institutions leverage heatmap analysis to revolutionize branch operations and customer experience delivery. Server-based video analytics platforms monitor customer flow patterns throughout banking facilities, revealing optimal teller positioning strategies and service desk configurations.
How banks can apply heat map analysis:
- Optimizing branch layouts based on traffic concentration analysis and customer-facing areas enables strategic distribution of promotional materials and advisory services.
- Queue management systems track wait times at various service points, from ATM locations to advisory areas, providing data-driven insights for staff allocation decisions.
- Peak-hour identification helps branch managers anticipate peak periods and adjust resources.
Stadium and Large Venue Management
- Game-day or concert chaos becomes manageable when stadiums understand crowd behavior. Video analytics track fan movement throughout events, preventing dangerous traffic jams before they occur.
- Concession stands generate more revenue when positioned along natural traffic flow routes. Similarly, vendors reduce wait times by understanding demand patterns during peak times.
- Exit planning uses historical data to design efficient crowd control strategies. Emergency evacuation routes become clearer when managers understand typical movement behaviors during different scenarios.
- Security teams distinguish between normal activity spikes and concerning behavioral changes through pattern recognition technology.
Railway Stations and Optimizing Passenger Flow
Transportation hubs move thousands daily, and the use of heat map analysis reveals exactly where passengers congregate and when they travel. Platform utilization data shows which areas experience dangerous overcrowding during rush hours. Dynamic signage systems then redirect passengers to less congested zones automatically.
Train scheduling becomes smarter when based on actual passenger demand rather than outdated estimates. Furthermore, safety improvements occur through early identification of high-risk congestion areas. Maintenance teams also can schedule cleaning and repairs during low-traffic periods identified through continuous monitoring data.
Smart Cities and Understanding Urban Flow
City planners make billion-dollar decisions based on limited pedestrian data. Video analytics provide comprehensive movement maps across commercial districts and public spaces.
Public transportation routes improve when based on actual foot traffic patterns rather than theoretical models. Bus stops relocate to areas where people actually walk.
Commercial districts benefit when city officials understand which areas attract most visitors. Infrastructure improvements target high-traffic zones that generate maximum economic impact. Event planning becomes scientific when historical movement data informs crowd management strategies for festivals and markets.
Restaurants
Heatmap analysis provides concrete data about customer behavior from entrance to exit. Table configurations are optimized based on natural traffic flows rather than assumptions.
Ordering counter queues shrink through strategic positioning of service points and menu displays. Outdoor seating analysis reveals customer preferences during different weather conditions.
Also you can learn more about: Smart Retail Solutions
Technical Infrastructure for Server-Based Heat map Analysis
Modern heat map analysis demands robust server infrastructure capable of handling multiple video streams simultaneously. Processing requirements include one virtual core per camera feed, with 2GB memory allocation per stream to ensure smooth real-time analysis.
Hardware Specifications
CPU performance requirements start at 2.4 GHz minimum processing speed, with support for various GPU configurations to optimize computer vision algorithm performance. Camera compatibility ranges from 2-megapixel resolution up to 4K support, with lens focal lengths between 3mm and 25mm.
Installation Flexibility
Camera positioning tolerances accommodate pitch angles from -15° to +15°, roll positioning from -180° to +180°, and yaw adjustments within -15° to +15° ranges. Day and night recognition capabilities maintain accuracy across varying lighting conditions, while normal lighting requirements exclude backlighting scenarios.
Data Management and Storage Efficiency
Server-based heat map analysis platforms optimize storage requirements through intelligent data compression and retention policies. Database records require approximately 150KB to 200KB per entry, significantly less than traditional video management systems.
Deployment Options
Edge processing configurations enable on-site data processing with minimal bandwidth requirements. Data center deployment supports centralized analytics for multiple locations, while hybrid arrangements combine local processing with cloud-based intelligence.
Integration capabilities include compatibility with existing video management systems such as Milestone and Genetec, plus standalone operation when required. Cloud deployment flexibility supports on-premise, private cloud, and public cloud configurations based on organizational requirements.
Also you can learn more about: Camera with Face Recognition
Heat map Analysis: Key Implementation Considerations
A successful heatmap strategy goes beyond simply generating a colorful image, it requires careful planning around data collection, interpretation, and ethical considerations to yield actionable insights.
Privacy and Compliance
Server-based heatmap analysis maintains visitor privacy through anonymized data collection that focuses on movement patterns rather than individual identification. Advanced algorithms process behavioral information without storing personally identifiable images or data.
Return on Investment
Organizations typically experience measurable improvements in operational efficiency, customer satisfaction, and resource utilization within months of implementation. Cost savings from optimized staffing, reduced energy consumption, and improved space utilization often justify the initial investment quickly.
Training and Adoption
User-friendly dashboard interfaces require minimal training for facility managers and operational staff. Comprehensive statistics presentation and custom query capabilities enable organizations to extract insights relevant to their specific operational requirements and performance objectives.
Also you can learn more about: Face Detection Cameras
1 Comment
Comments are closed.
[…] Learn more about: Heat Map Analysis […]