What a Retail Heatmap Reveals About Dwell Time vs. Buy Time
- March 25, 2026
- Posted by:
- Categories: Articles, Articles & Blogs
A retail heatmap surfaces what transaction records never will: where customers go, how long they stay, and which areas they bypass entirely. For retail executives and operations managers trying to close the gap between floor space investment and revenue performance, that visibility changes how layout and merchandising decisions are made, and what evidence those decisions rest on.
Any CTO/COO needs to know how retail heatmap technology works, what operational decisions it supports, and how AvidBeam‘s AvidSight platform delivers that intelligence through existing camera infrastructure. Here is how:
Retail Heatmap Technology 101
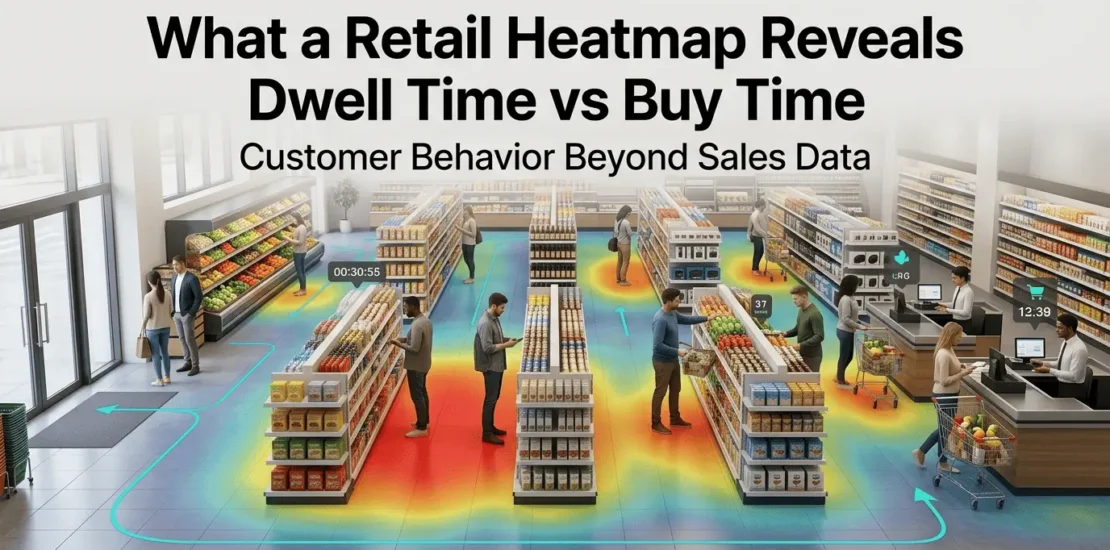
The output of the retail heatmap is a color-coded overlay of your store floor plan:
- Red and orange mark high-activity zones.
- Blue and green indicate areas with low foot traffic or minimal dwell time.
The intelligence behind that visual draws on computer vision algorithms and deep learning models processing continuous video feeds. And a heatmap pulls from four data layers:
- Movement paths that show the routes customers follow from entry through product zones to checkout
- Dwell time and how long individuals stay in specific areas
- Density patterns and how many people occupy a zone across different time windows
- Behavioral signals, such as stops and engagement indicators, that suggest purchase consideration
Together, those layers produce a picture of store performance that sales data alone cannot replicate. A product section with low conversion might show high dwell time on a retail heatmap, and that distinction matters when deciding whether to reposition a product, adjust pricing, or change the display configuration.
| To find out how AvidSight capabilities apply to your store format and existing camera setup, fill the form from here and the team will follow up with a technical assessment |
Where Retail Heatmap Data Changes Layout Decisions
Traditional layout decisions lean on supplier agreements and category frameworks built around product logic, not observed behavior. A retail heatmap introduces a different input: what customers do inside the store, independent of what they ultimately buy.
That shift surfaces several categories of operational insight:
- Dead zones and floor space receiving minimal foot traffic despite proximity to active sections, often candidates for repositioning rather than restocking
- Congestion points like narrow aisles, obstructive displays, or checkout configurations that slow customer flow and push up abandonment risk
- High-engagement zones and areas where dwell time runs consistently high
- Bypass patterns and sections that customers walk past without entering
Staffing and Operations From Heatmap to Schedule
Layout optimization is one application. Staffing alignment tends to deliver faster returns, and the data pathway is direct. A retail heatmap generates time-stamped occupancy data across zones throughout the operating day. That data reveals:
- Which hours produce peak density in specific departments
- Where customer-to-staff ratios drop during high-traffic periods
- When checkout queue lengths cross thresholds that correlate with cart abandonment
- Which sections hold sustained dwell time long enough to suggest customers need assistance
Learn more about: Heatmap Software for CCTV
How AvidBeam’s AvidSight Delivers Retail Heatmap Intelligence
AvidBeam‘s AvidSight platform, specifically its AB – Retail product, generates retail heatmap outputs through server-based video analytics layered onto existing surveillance cameras. No specialized hardware replacement is required, and the analytical capability sits on top of the infrastructure organizations already have. AvidSight’s retail heatmap functionality is part of a broader behavioral analytics suite:
- Visitor counting, such as daily, weekly, and monthly traffic, with entry/exit tracking and unique visitor identification to eliminate duplicate counts
- Pathway analysis for customer route mapping from the entrance through product areas to checkout
- Dwell time measurement and zone-level engagement metrics showing which areas retain attention
- Demographic analysis, age distribution, and gender ratio data across store sections
- Queue performance analytics and wait time monitoring, queue length tracking, and bottleneck identification before congestion becomes operationally disruptive
- Predictive traffic forecasting and historical pattern analysis
The heatmap layer connects these data streams into a visual management interface to give operations teams a store-wide performance view without navigating separate reports for each metric.
Learn more about: Heatmap Analytics
AvidSight’s Technical Infrastructure and Deployment
AvidSight runs on infrastructure that most retail organizations already have in place that keeps the deployment path straightforward. Here are AvidSight’s key specifications:
| Processing | Minimum CPU clock speed of 2.4 GHz; multiple GPU configurations supported for enhanced computer vision performance |
| Camera compatibility | 2MP to 4K resolution; lens focal length from 3mm to 25mm |
| Positioning tolerance | Pitch angle -15° to +15°; roll -180° to +180°; yaw -15° to +15° |
| VMS integration | Milestone, NetworkOptix, and Genetec platforms via ONVIF-compliant protocols |
| Deployment options | On-premise, private cloud, public cloud, or hybrid configurations |
AvidBeam deployment flexibility supports multi-site retailers managing different infrastructure profiles across their estate. A flagship store running on-premise servers and a smaller format location on cloud infrastructure can both operate AvidSight’s retail heatmap capabilities through the same platform without requiring a standardized hardware baseline.
Learn more about: Retail Video Analytics Solutions
AvidSight and Turning Retail Heatmap Data Into Decisions
Heatmap data sitting in a dashboard produces no operational return. The value comes from connecting what the heatmap reveals to decisions that get acted on (layout changes tested and measured, staffing schedules adjusted against verified peak periods, promotional placements validated against dwell time rather than category intuition).
AvidSight supports that workflow through customizable alerts and historical trend analysis. Also, AvidGenAI layer lets operations staff query the platform in natural language; a store manager can ask a question in natural language and get a direct answer without pulling multiple reports. That accessibility reduces the distance between data collection and operational response, particularly for teams without dedicated analytics resources.
Also you can learn more about: Perimeter Alarm Systems
Frequently Asked Questions
What is heat mapping in retail?
A retail heatmap is a visual representation using a color gradient of customer movement and activity within a store, generated through video analytics (typically red and orange for high-activity zones, blue and green for low-activity areas). Each of these colors shows where customers go, dwell time, and how long they stay, and which areas receive minimal engagement.
What is the purpose of a heatmap?
A heatmap gives store operators evidence-based visibility into how floor space is actually being used to optimize layout, merchandising decisions, staffing alignment, and promotional placement. Video analytics platforms, such as AvidSight, replaces assumptions about customer behavior with observed movement and engagement data, which makes it useful for both day-to-day operations and longer-term store format planning.
1 Comment
Comments are closed.
[…] Also you can learn more about: Retail Heatmaps […]