Heatmap CCTV in 2026: How AvidBeam Turns Surveillance Footage Into Spatial Intelligence
- June 24, 2026
- Posted by:
- Category: Articles
Closed-Circuit Television (CCTV) cameras record how people move through a space. However, most organizations never extract that movement data. The footage sits in storage. Decisions about layout, staffing, and space planning continue to rely on assumptions rather than evidence.
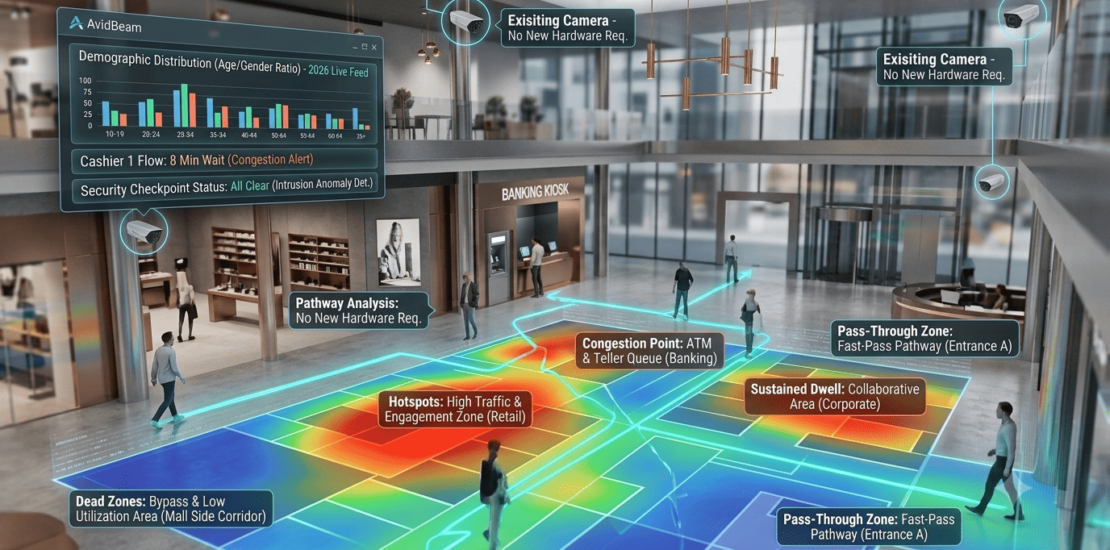
A CCTV heatmap changes that. It converts continuous camera feeds into a color-coded spatial overlay, showing where people concentrate, where they avoid, and how long they stay in each area. Consequently, managers gain a visual record of actual behavior rather than assumed patterns.
AvidBeam’s AvidSight platform delivers this through Artificial Intelligence (AI) video analysis on existing camera infrastructure. No new hardware is required. Furthermore, the heatmap output connects to pathway analysis, demographic data, queue performance, and security monitoring, all through the same platform.
What a CCTV Heatmap Actually Produces
The output of a CCTV heatmap is deceptively simple. However, the intelligence behind it draws on multiple data streams simultaneously. Understanding both the visual output and the underlying data layers is essential for applying heatmap analysis to operational decisions effectively.
Reading the Color Scale
A CCTV heatmap overlays the monitored floor plan with a color gradient. Red and orange mark areas where foot traffic concentrates or dwell time runs consistently long. Blue and green indicate low-activity zones, areas people pass through quickly or avoid altogether.
The gradient answers the foundational question: where are people spending time, and where are they not? Notably, that question cannot be answered from transaction data or observation alone. It requires continuous spatial tracking across the full monitored area.
The Data Layers Behind the Visual
The heatmap visual is the summary. Behind it, AvidSight processes four data layers simultaneously from the CCTV feeds:
- Movement paths: the routes people follow from entry through zones to exit, regardless of what they ultimately do in each area
- Dwell time: how long individuals remain in specific zones; this separates areas people pass through from areas where they stop and engage
- Density patterns: how many people occupy a zone across different time windows and hours of operation
- Engagement signals: stops and behavioral indicators near specific points that suggest active interaction rather than passive movement
Together, these layers produce a spatial intelligence picture that no single data source replicates. Moreover, they update continuously — so the heatmap reflects current behavior, not a historical snapshot.
To find out how AvidSight’s CCTV heatmap capabilities apply to your existing camera infrastructure, send an email to [email protected], and the team will follow up. |
How AvidSight Generates CCTV Heatmap Intelligence
AvidSight applies AI video analysis to existing CCTV camera feeds through a server-based architecture. This means all processing happens centrally, not at the camera. As a result, the analytical capability is not constrained by individual camera hardware. Any Open Network Video Interface Forum (ONVIF) – compliant camera already covering a monitored space connects to the platform without replacement.
Server-Based Processing on Existing Cameras
Server-based processing delivers two practical advantages for CCTV heatmap deployments. First, detection model accuracy stays consistent across all connected cameras, regardless of camera model, age, or position. Second, capability updates deploy through software across the full network simultaneously. Consequently, organizations extend CCTV heatmap coverage to cameras already installed rather than investing in new hardware.
The infrastructure baseline is straightforward: 2GB RAM and one virtual core at 2.4 GHz per camera processed. Additionally, Video Management System (VMS) integration covers Milestone, NetworkOptix, and Genetec platforms. Therefore, AvidSight connects to whichever system a facility already runs.
Connected Analytics Alongside the Heatmap
AvidSight’s CCTV heatmap output connects to a broader behavioral analytics suite running on the same feeds. Each module adds a separate intelligence layer:
- Visitor counting: entry and exit counts across daily, weekly, and monthly windows with unique visitor identification
- Pathway analysis: route mapping from entrance through zones to checkout or exit point
- Dwell time measurement: zone-level engagement duration metrics
- Demographic analysis: age estimation and gender distribution per zone
- Queue performance: wait time and queue length per service point with congestion alerts
- Traffic forecasting: historical pattern analysis projecting future footfall by hour, day, and season
Furthermore, AvidGenAI enables natural language queries across the full platform. An operations manager can ask which zone had the highest dwell time between specific hours and receive a direct answer, without pulling separate reports per metric.
CCTV Heatmap Applications by Environment
The CCTV heatmap applies across environments wherever the way people use a space determines operational or commercial decisions. In each case, the underlying technology is identical. What changes is which insight the heatmap reveals and which decisions it informs.
| Environment | Primary Use Case | What the CCTV Heatmap Reveals |
|---|---|---|
| Retail stores | Product placement, layout, and promotional positioning | Identifies dead zones, bypass patterns, and high-engagement areas across the store floor plan |
| Shopping malls | Common area usage, tenant zone performance, and footfall routing | Reveals which corridors drive sustained engagement versus which ones customers avoid |
| Banking branches | Teller zone coverage, ATM usage, and service area distribution | Surfaces staffing gaps and queue build-up before they affect service quality |
| Corporate buildings | Floor plan utilization, meeting room occupancy, and desk usage | Informs space planning decisions with observed behavior — not assumed capacity figures |
| Event venues | Crowd flow, stage zone density, and exit route utilization | Identifies crowd concentration risks before they reach safety thresholds |
| Government facilities | Zone usage patterns, access corridor flow, and restricted area activity | Combines with AvidGuard’s security layer for behavioral anomaly detection alongside occupancy data |
| Hospitality properties | Lobby usage, dining area distribution, and guest movement patterns | Supports layout and staffing decisions across common areas with verified traffic data |
In every case, the heatmap starts with the same question: Are people using this space the way we intended? The answer, consistently revealed through the spatial overlay, changes the quality of every layout, staffing, and security decision that follows.
Security Intelligence on the Same Platform
CCTV heatmap analysis and security monitoring typically run on separate systems. One platform generates the spatial intelligence. Another monitors for threats. As a result, operations teams manage two interfaces and two data streams that rarely speak to each other.
AvidBeam integrates both on the same platform. AvidGuard’s behavioral anomaly detection runs on the same CCTV feeds that generate the heatmap layer. Consequently, loitering detection, intrusion alerts, and crowd density warnings appear in the same interface as footfall data and pathway analysis.
That integration matters operationally. For example, a crowd density anomaly alert in a shopping mall can be cross-referenced immediately with the heatmap data for that zone, giving the security team both the alert and the spatial context in one view. Similarly, a dead zone identified in the heatmap can be reviewed against AvidGuard’s behavioral baseline for that area to confirm whether the low activity is normal or anomalous.
Standard CCTV vs. AvidBeam Heatmap – Comparison
The table below sets out where AvidSight’s CCTV heatmap platform diverges from standard CCTV infrastructure at the intelligence and operational capability level.
| Capability | Standard CCTV Without Analytics | AvidBeam CCTV Heatmap Platform |
|---|---|---|
| Spatial intelligence | Raw footage only, no movement data extracted | Color-coded overlay of movement density and dwell time across the full floor plan |
| Dwell time data | Not available without manual review | Zone-level engagement duration measured continuously across all connected cameras |
| Pathway analysis | Not detectable from footage alone | Customer or visitor routes mapped from entry through zones to exit |
| Demographic data | Not available | Age and gender distribution per zone extracted from existing cameras |
| Queue monitoring | Manual observation only | Real-time queue length and wait time per service point with congestion alerts |
| Security integration | Separate system required | AvidGuard anomaly detection runs on the same feeds — unified platform |
| Hardware requirement | Dedicated people-counting sensors often required | Layers onto existing Closed-Circuit Television (CCTV) cameras — no new hardware |
| Multi-site management | Separate system per location | Unified interface across all sites; cross-location comparison from one dashboard |
In short, standard CCTV records behavior. AvidBeam’s CCTV heatmap platform interprets it, producing spatial intelligence, demographic data, queue performance metrics, and security anomaly detection from the cameras already in place.
Infrastructure and Deployment
AvidSight connects to any ONVIF-compliant CCTV camera via standard network protocols. All heatmap processing runs centrally, not at the camera. Therefore, no specialized people-counting hardware or sensor installation is required.
The infrastructure baseline per camera processed:
- 2GB RAM minimum; one virtual core at 2.4 GHz minimum
- Multiple Graphics Processing Unit (GPU) configurations supported for higher-density deployments
- Camera resolution: 2MP up to 4K; lens focal length 3mm to 25mm
- Pitch -15° to +15°; roll -180° to +180°; yaw -15° to +15°
Deployment options include on-premise, private cloud, public cloud, and hybrid, based on data governance requirements. For multi-site organizations, all locations feed into a single management interface. Consequently, cross-site heatmap comparison and unified demographic reporting are available without navigating separate systems per location.
| To kick off a technical evaluation of AvidSight’s CCTV heatmap capabilities for your facility, reach out to AvidBeam’s team directly via email. The team will follow up with a deployment assessment matched to your current camera infrastructure. |
Frequently Asked Questions
What is a CCTV heatmap?
A color-coded spatial overlay of movement density and dwell time across a monitored area, generated from existing CCTV camera feeds through AI video analysis.
How does AvidSight generate a CCTV heatmap?
AvidSight processes continuous CCTV feeds through AI models that extract movement paths, dwell time, and density patterns, converting raw footage into a structured spatial intelligence overlay.