What Is Heatmap Analysis? A Guide to Visual Data Insights
- November 19, 2024
- Posted by:
- Category: Articles

Heatmap analysis has emerged as the unsung champion of data visualization. They’re simple and colorful and can turn complex data into a story we can instantly see and understand. Whether you’re a business owner, marketer, or just a data enthusiast, heatmap analysis offers a fresh way to look at the numbers. Let’s dig into what heatmaps are, why they’re valuable, and how they can transform raw data into insights you can act on.
Why is Heatmap a Game-Changer?
Imagine being able to “see” where website visitors are clicking most, which store areas attract the most customers, or where there are bottlenecks in your floor layout. That’s what heatmap analysis does: it gives you visual clarity on what’s working, what’s not, and where to direct your energy. It’s like having a superpower for interpreting data, and the best part? You don’t need to be a data scientist to understand it.
What is Heatmap Analysis?
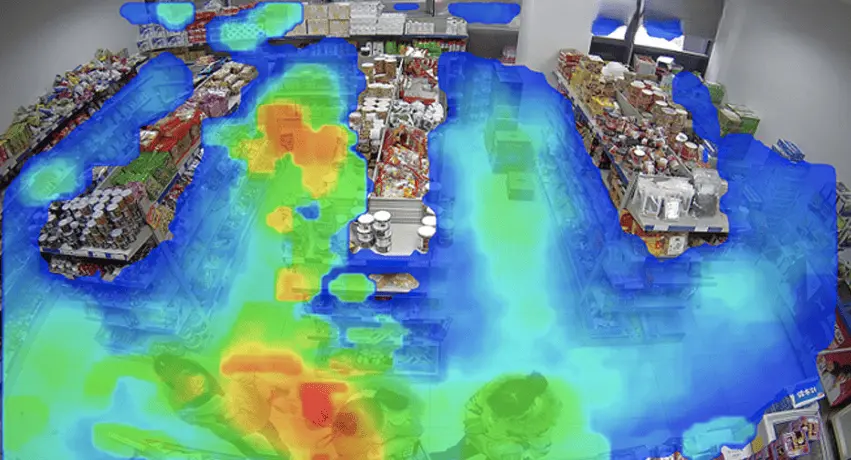
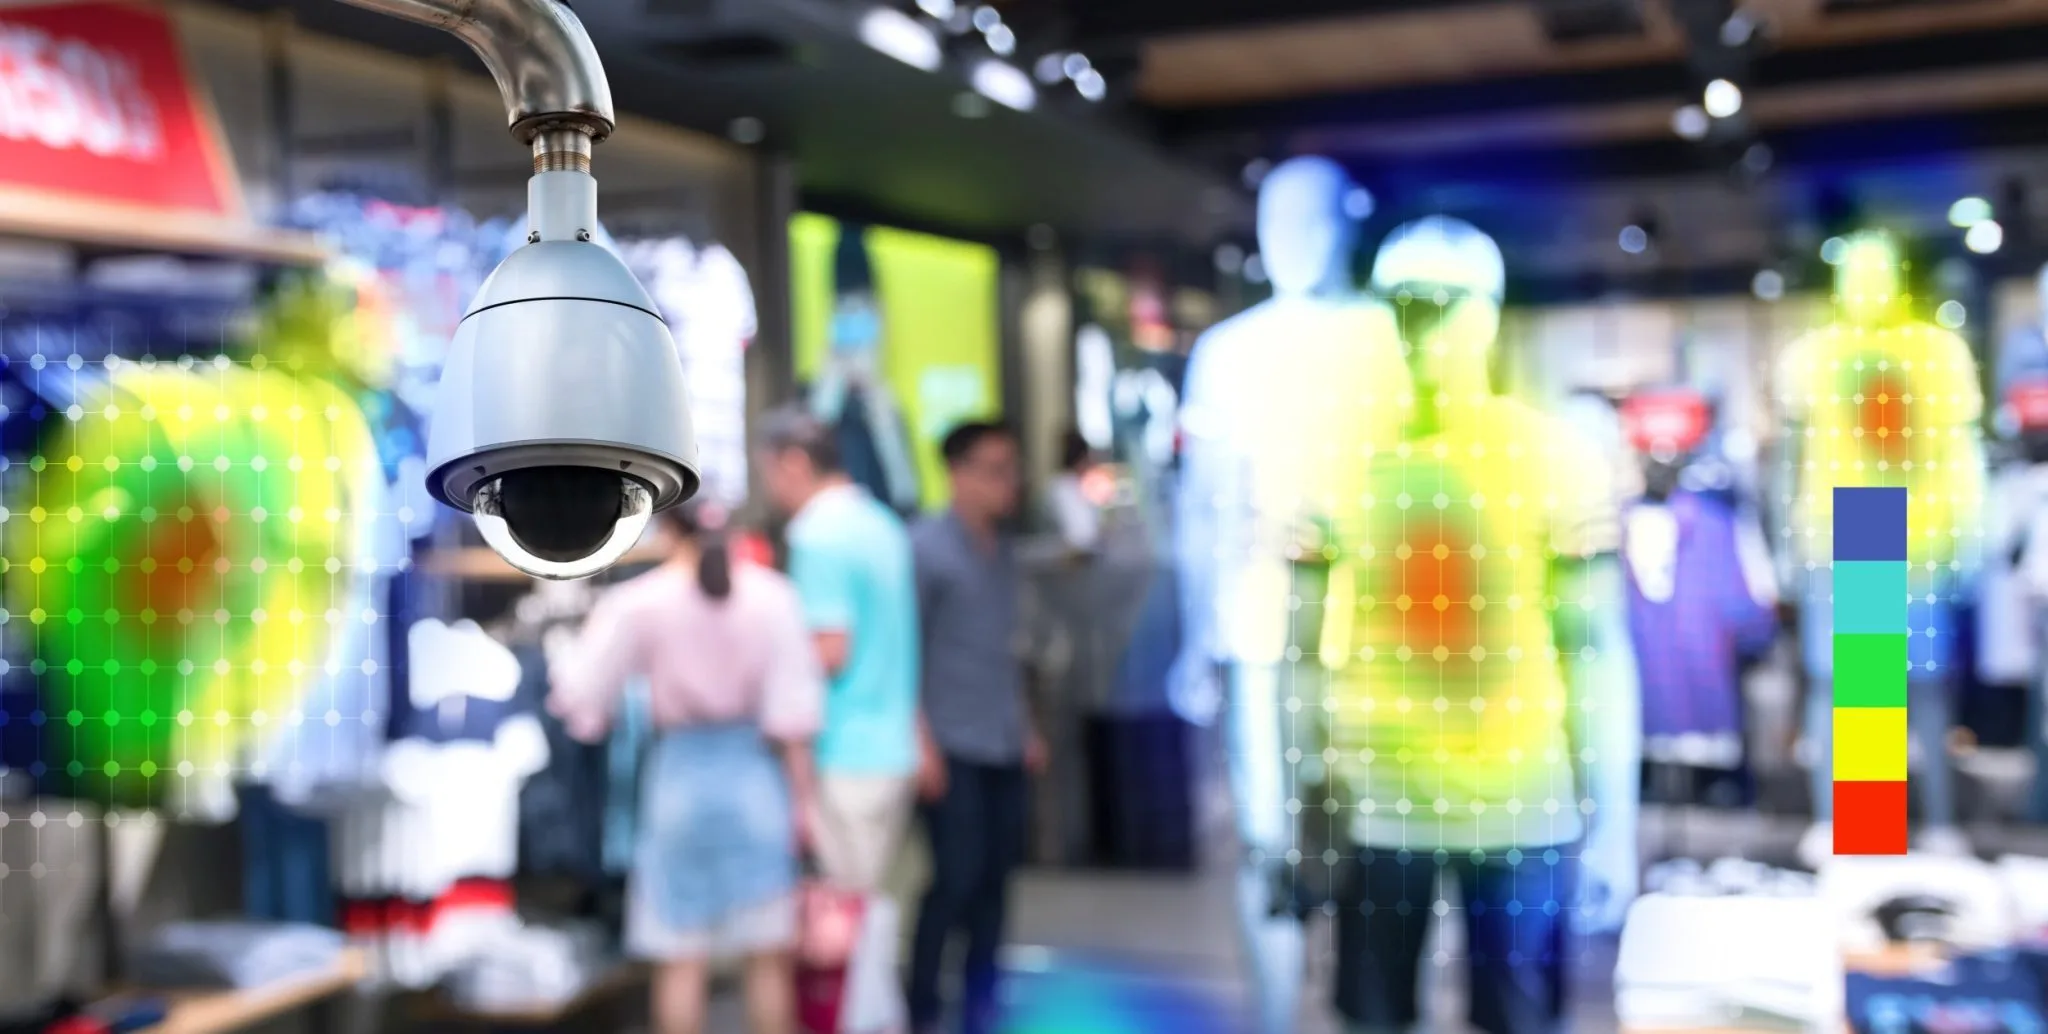
Alright, so what exactly is heatmap analysis? In simple terms, it’s a way of visualizing data where colors represent values. Think of a heatmap as a map of “hot” and “cold” areas: the warmer the color (like red or orange), the higher the value, while cooler colors (like blue) represent lower values.
By looking at these color patterns, you can immediately identify trends, clusters, or problem areas without sifting through endless rows of numbers.
Businesses use heatmaps for all sorts of things. From tracking clicks on websites to seeing foot traffic patterns in a store, heatmap analysis helps to reveal valuable insights at a glance.
 Choosing the Right Fit for Your Data Needs
Heatmaps come in a few different flavors, and each type is perfect for different kinds of insights. Let’s break down the main types so you can decide which might be right for your business:
- Geographical Heatmaps: These show data spread over a map and are great for businesses that want to understand regional or global data distribution—think delivery zones or regional sales hotspots.
- Activity Heatmaps: These highlight patterns over time. They’re useful for spotting trends, such as when your website gets the most traffic or the busiest hours in a retail store.
- User Interaction Heatmaps: This is the go-to for websites and apps. They show you where users are clicking, scrolling, and spending the most time, helping you make data-backed design decisions.
How Heatmap Works: The Magic Behind the Colors
Creating a heatmap is essentially taking raw data and turning it into a “picture” you can analyze. Behind the scenes, a heatmap tool gathers data points and translates them into color-coded visuals on a grid. The “hotter” colors indicate higher data values—like lots of clicks or foot traffic—while “cooler” colors show less activity.
For instance, a heatmap analysis of a website could show where users tend to click most, helping you see which calls-to-action are working and which may need a little TLC. It’s as easy as looking at a color-coded map!
Benefits of Heatmap Analysis: Why Businesses Rely on It
The appeal of heatmap analysis lies in its ability to simplify complex data and make it actionable. Here are some of the biggest reasons businesses love using heatmaps:
- Instant Visual Feedback: With heatmaps, you don’t need a data science degree to understand the trends in your data. Just a glance, and you’re good to go.
- Better Decision-Making: By making data visually accessible, heatmaps help teams make faster, smarter decisions. No more guesswork; heatmaps show you exactly where the action is.
- Enhanced User Experience: On websites, heatmaps reveal user patterns, allowing for design tweaks that improve customer experience and even conversion rates.
AvidBeam’s Heatmap Analysis Solutions
AvidBeam has some pretty innovative solutions to take heatmap analysis to the next level. Known for their AI-powered visual analytics, AvidBeam’s heatmap tools provide specialized insights that allow businesses to monitor areas of high traffic, track behaviors, and even enhance security measures.
Their heatmap solution works seamlessly across sectors, helping companies improve efficiency and make data-backed decisions. With AvidBeam, you get a tool that’s powerful, smart, and designed to grow with your data needs.
Real-World Applications of Heatmaps Analysis
The versatility of heatmaps means they work for all kinds of industries. Here’s a quick look at how different sectors are using heatmap to make smarter choices:
- Retail: Stores analyze foot traffic heatmaps to find out which areas get the most attention, allowing them to arrange products in ways that maximize exposure.
- E-commerce: Websites rely on heatmaps to see where users click, scroll, or hesitate, helping to improve page layouts and boost conversion rates.
- Healthcare: Hospitals can use heatmap analysis to analyze patient movement, optimize layouts, and improve the efficiency of patient care.
Reading Heatmap Data: Making Sense of Color Patterns
Interpreting heatmaps doesn’t have to be complicated. Here are some quick tips for reading your heatmap analysis results:
- Focus on Hot Spots: These areas show where the most activity is happening. If you see bright red on a call-to-action button, that’s a good sign!
- Consider Context: High activity in an area might be related to seasonality, promotions, or other outside factors.
- Track Changes Over Time: Comparing heatmaps over different periods lets you see if recent changes made an impact.
 AI and Heatmaps Analysis
AI has transformed heatmap analysis, it’s adding predictive capabilities and pattern recognition. With AI-driven heatmaps, businesses can spot trends before they fully emerge, helping them stay one step ahead. For instance, AvidBeam’s AI-based heatmap solutions offer tools to filter and prioritize activity in a way that reduces the burden on human analysts.
All in All
In today’s competitive landscape, heatmap analysis offers businesses a powerful way to make informed decisions. It’s streamlining physical spaces, revealing trends and patterns that drive better decisions. Check out the AvidGuard solution NOW! and ask our experts about the outstanding features.
2 Comments
Comments are closed.

[…] stands out in the AI-powered video analytics world and comes up with innovative solutions to take heatmap analysis to the next level. One of their flagships is the AvidGuard system, which is a watchful guardian […]
[…] Also you can learn more about: Heatmap Analysis […]