PPE Analytics: How AI-Powered Compliance Monitoring Prevents Workplace Fatalities in 2026
Personal Protective Equipment (PPE) analytics represents the convergence of artificial intelligence and computer vision and it offers organizations unprecedented capabilities to monitor protective equipment compliance across diverse and large-scale operating environments. Traditional safety oversight models relied on periodic manual inspections conducted by human supervisors who could not maintain continuous surveillance across multiple locations at the
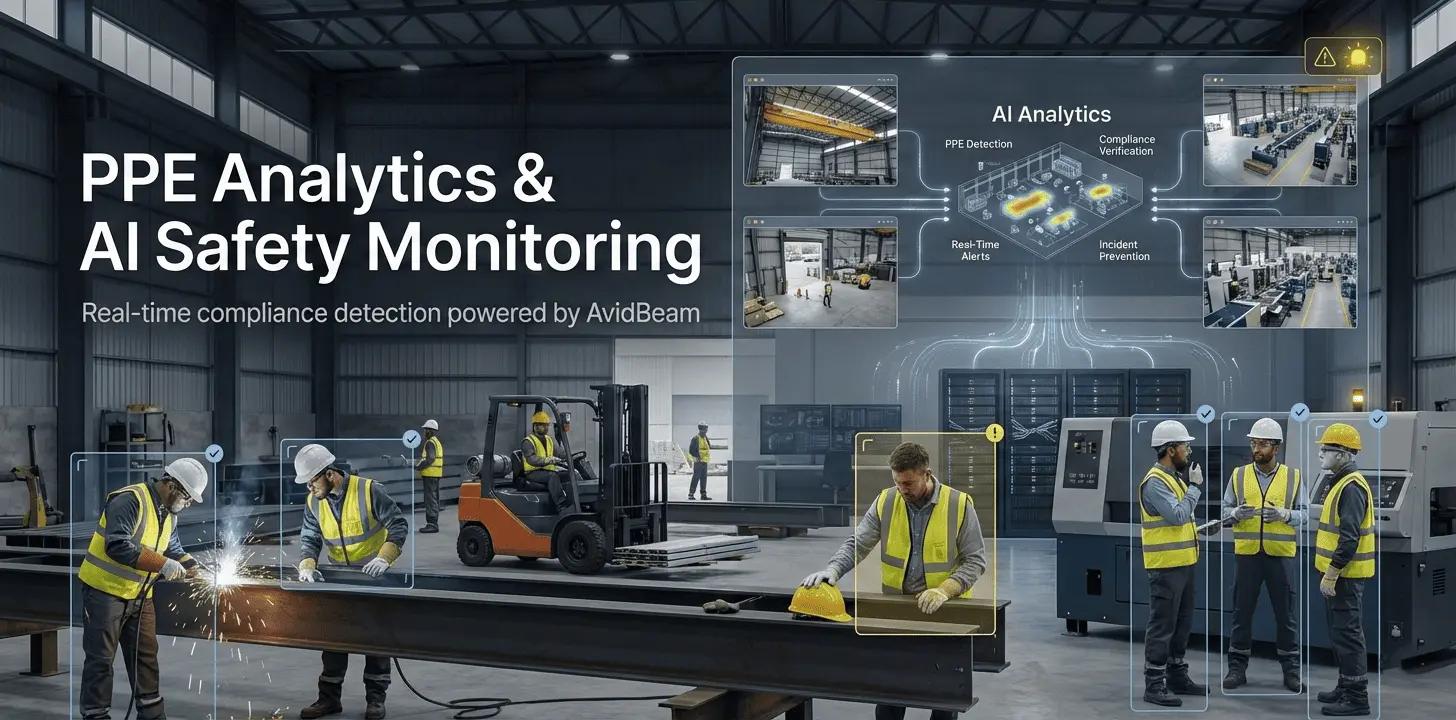
Personal Protective Equipment (PPE) analytics represents the convergence of artificial intelligence and computer vision and it offers organizations unprecedented capabilities to monitor protective equipment compliance across diverse and large-scale operating environments.
Traditional safety oversight models relied on periodic manual inspections conducted by human supervisors who could not maintain continuous surveillance across multiple locations at the same time. Modern PPE analytics platforms, such as AvidBeam’s, process video streams through centralized intelligence systems that:
- Recognize equipment types
- Verify proper usage
- Trigger immediate alerts when noncompliance occur
Modern PPE analytics are fundamentally transforming how organizations approach worker protection in hazardous environments.
| Bureau of Labor Statistics data reveals that the construction industry (alone) fatalities accounted for 423 deaths in 2023, representing approximately one in five workplace deaths. Falls, slips, and trips caused 38.5 percent of these construction deaths, with the construction sector accounting for 47.8 percent of all fatal falls across industries (Bureau of Labor Statistics). |
How PPE Analytics Systems Process Compliance Data
Smart PPE analytics platforms utilize computer vision algorithms trained on millions of images captured across varying angles, lighting conditions, and partial obstructions.
- Hard hats appear substantially different when viewed from overhead positions versus side angles.
- Safety glasses become nearly invisible under certain lighting scenarios.
- Respirators get partially hidden during overhead work when workers raise their arms.
- Gloves become obscured while personnel manipulate tools and equipment.
Each equipment category requires distinct recognition models capable of identifying proper usage despite environmental variables.
Advanced personal protective equipment (PPE) analytics solutions process multiple camera feeds simultaneously through centralized processing units optimized for GPU acceleration.
For instance, a petrochemical facility operating three shifts with 500 workers across 12 processing units generates approximately 180,000 worker-camera interactions daily. Each interaction demands real-time analysis across multiple equipment categories including head protection, eye shields, respiratory devices, hand coverings, and high-visibility garments. And this scenario requires effective PPE analytics demands robust infrastructure specifications:
- Minimum 2GB memory allocation per camera feed
- CPU processing power of 2.4 GHz or higher
- One dedicated virtual core per camera stream
- GPU card support for enhanced algorithm performance
- Camera compatibility ranging from 2-megapixel through 4K resolution systems
Personal Protective Equipment (PPE) Analytics & Market Evolution
Smart personal protective equipment (PPE) market valuations demonstrate the acceleration of safety technology adoption across high-risk industries. The global market reached USD 2,938.0 million in 2024 and projections indicate growth to USD 9,827.7 million by 2033, representing a compound annual growth rate of 14.5% throughout the forecast period (Grand View Research, 2025).
Real-Life Scenario: PPE Analytics & Zone-Based Detection
Smart personal protective equipment (PPE) analytics platforms understand that compliance requirements vary across different facility zones. A painter removing respiratory protection in designated break areas poses no immediate risk. However, the same action near chemical exposure zones triggers immediate alerts because the system recognizes the contextual difference between safe and hazardous locations.
This contextual awareness extends beyond simple presence detection. Modern systems track individual worker movements across facility zones, correlating equipment requirements with specific area hazards. When welders enter confined spaces, the platform verifies not only that flame-retardant clothing is worn but also that respiratory equipment meets specifications for the particular chemical environment present in that location.
Real-time processing capabilities allow PPE analytics systems to identify violations within seconds rather than waiting for scheduled supervisor rounds. When a technician enters a high-voltage maintenance area without insulated gloves, security personnel receive instant notifications enabling immediate intervention before electrical contact occurs. This response speed fundamentally changes safety outcomes by eliminating the vulnerability windows that exist between violation occurrence and detection.
Also you can learn more about: Personal Protective Equipment Detection
PPE Analytics Benefits for Different Businesses
- Oil and gas operations: Specialized monitoring of respiratory protection in chemical exposure zones and eye protection compliance during drilling operations where projectile hazards exist.
- Manufacturing facilities: Consistent glove usage near machinery, hearing protection compliance in high-noise environments, and proper footwear verification in areas where heavy materials create crushing risks.
- Healthcare environments: Face mask detection, protective gown monitoring in infectious disease units, and hand protection verification during procedures involving biological hazards.
- Trade, transportation, and utilities sectors: Equipment compliance monitoring across warehouse operations, loading dock activities, and field service locations where workers operate independently without direct supervision.
- Financial services organizations: Visitor management capabilities that verify contractor equipment compliance when maintenance personnel access server rooms, rooftop installations, or other areas requiring protective equipment.
How to Choose the Best Smart PPE Analytics Platform
Organizations evaluating personal protective equipment (PPE) analytics solutions should prioritize platforms offering comprehensive detection capabilities across multiple equipment categories. Rather than single-purpose systems requiring separate deployments for each compliance requirement. AvidGuard from AvidBeam Technologies exemplifies this unified approach, delivering PPE detection alongside intrusion monitoring. Loitering identification, smoke and fire detection, crowd analysis, and behavioral anomaly recognition through a centralized processing architecture.
Smart PPE Analytics Essential Selection Criteria
- Platforms supporting ONVIF camera protocols and integrating with established Video Management Systems (VMS) like Milestone and Genetec eliminate costly surveillance system replacements and add intelligent analytics capabilities to existing investments.
- Systems requiring a minimum 2GB memory per camera with 2.4 GHz CPU processing. Such as AvidGuard, allow gradual coverage expansion without infrastructure overhauls as monitoring needs grow.
- GPU acceleration support and efficient algorithm optimization prevent performance degradation during peak operational periods when maximum worker density creates the highest verification demands.
- Customizable notification protocols enable immediate intervention when violations occur, transforming PPE analytics from documentation tools into active safety management systems.
- Request trial implementations in representative facility zones to evaluate detection accuracy across specific lighting conditions. Camera angles, and operational environments before committing to enterprise-wide rollouts.
| Next-generation PPE analytics platforms will incorporate generative AI capabilities, enabling conversational interfaces where safety managers query systems using natural language. Safety directors could ask which areas showed the most hard hat violations during previous weeks or request detailed circumstances surrounding specific respiratory protection incidents. |
Learn more about: Safety Equipment and PPE
Case Studies: PPE Analytics Industry-Specific Applications
AvidBeam solutions have been implemented across numerous industrial facilities in several countries, demonstrating major operational successes, including:
- SABIC in Saudi Arabia: The world’s fifth-largest petrochemical company deployed AvidBeam‘s intelligent video analytics solutions. To manage thousands of workers across multiple sites and to ensure smooth operations. The AvidGuard platform developed by AvidBeam team utilized these massive facilities to provide multiple protection layers.
- MARS Factory Egypt: Executives at MARS Factory Egypt understood the sensitivity of food manufacturing environments and recognized the need for PPE analytics platforms that address hygiene requirements alongside safety compliance standards. Leading them to select AvidBeam platforms. Workers moving between packaging zones require basic hair coverings and gloves. And strict food safety regulations must be maintained alongside smooth, unobstructed operational flow, objectives achieved through the implementation of AvidGuard video analytics platform.
- ADNOC-EFC Factories Egypt: The facility deployed PPE analytics solutions to monitor compliance with safety helmets, glasses, gloves, and high-visibility vests. The intelligent video analytics approach recognizes common occupational hazards in industrial environments and protects workers from them. Significantly improving safety protocols and operational efficiency.
Learn more about: Visual Language Model
 Article
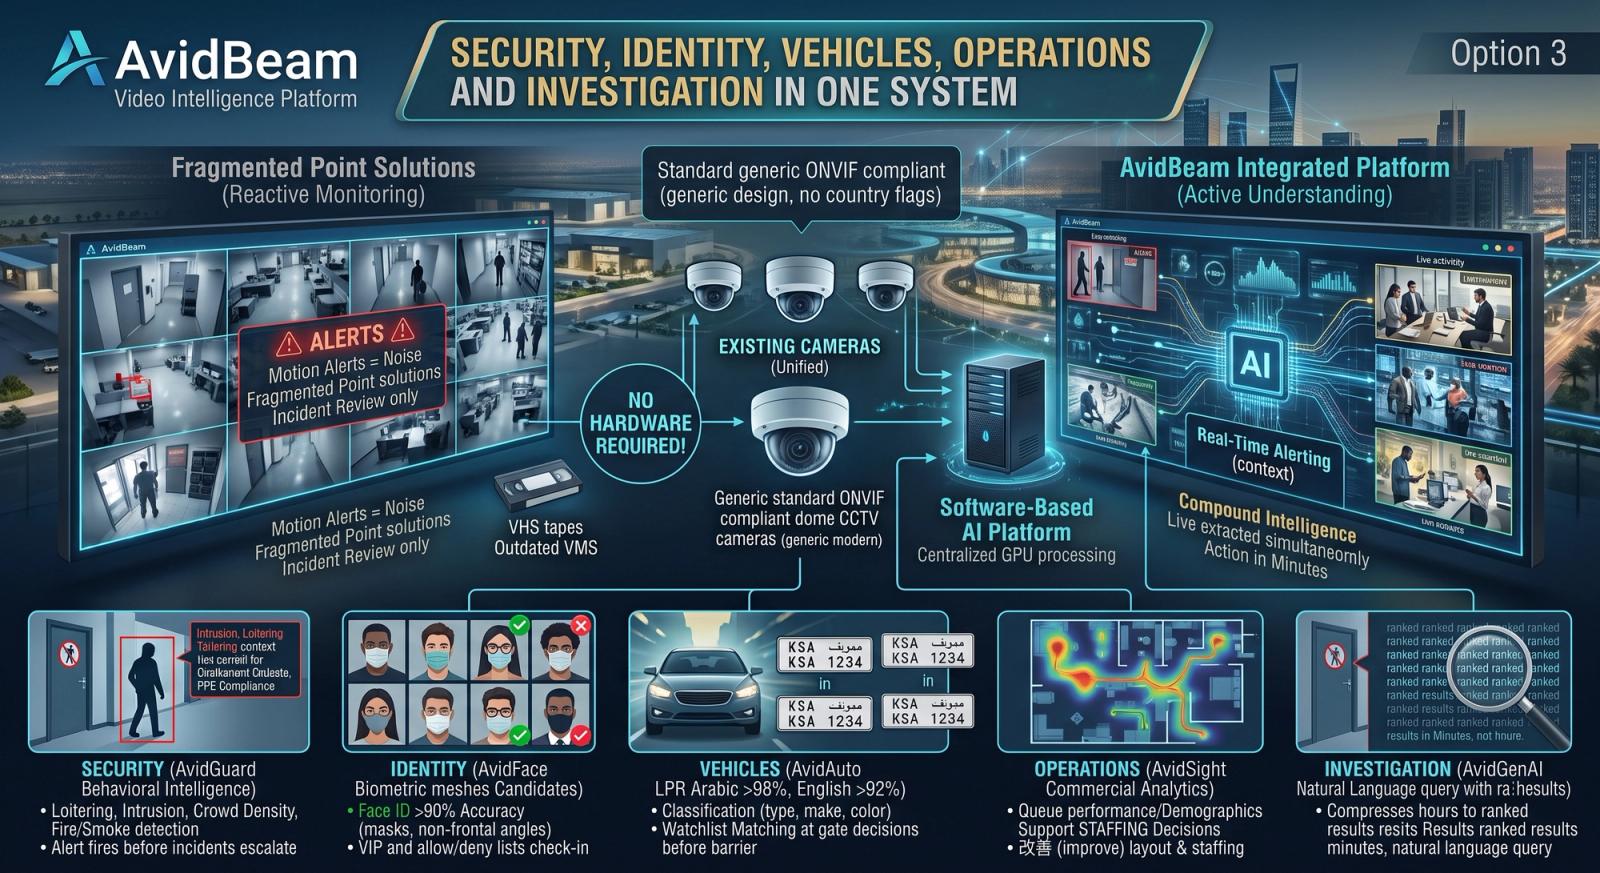
Video Intelligence Platform Explained: Security, Identity, Vehicles, Operations and Investigation in One System
A video intelligence platform is a software system that extracts multiple categories of structured intelligence from camera feeds simultaneously: behavioral security alerts, identity verification
 Article
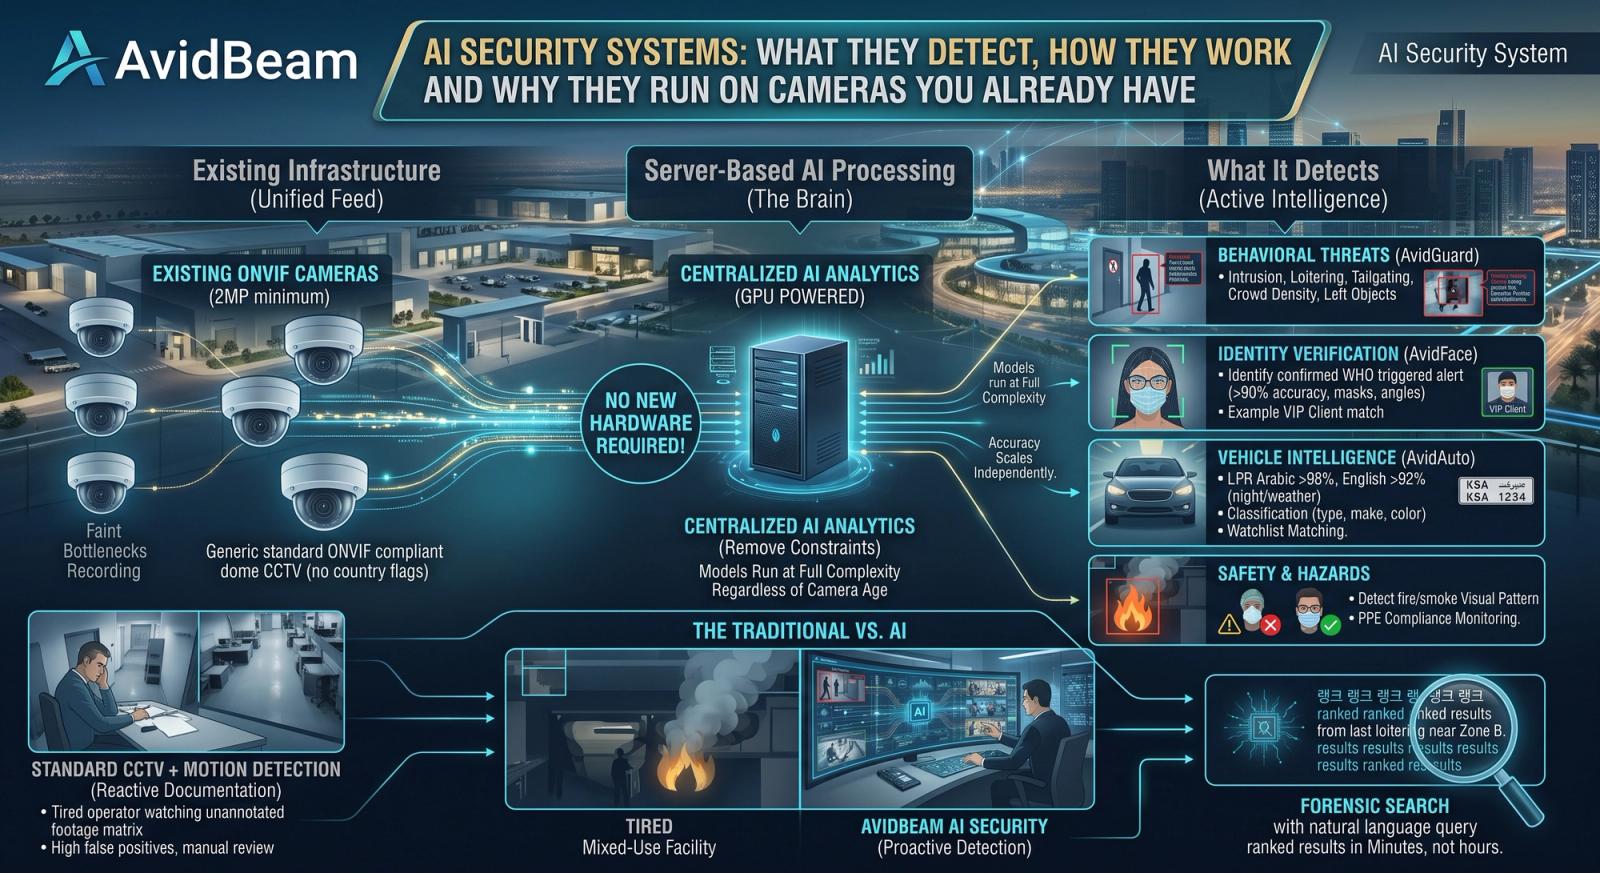
AI Security Systems: What They Detect, How They Work and Why They Run on Cameras You Already Have
An AI security system is a platform that applies artificial intelligence to camera feeds to detect threats, verify identities, and generate security alerts automatically, without requiring a person to monitor screens continuously.
 Article
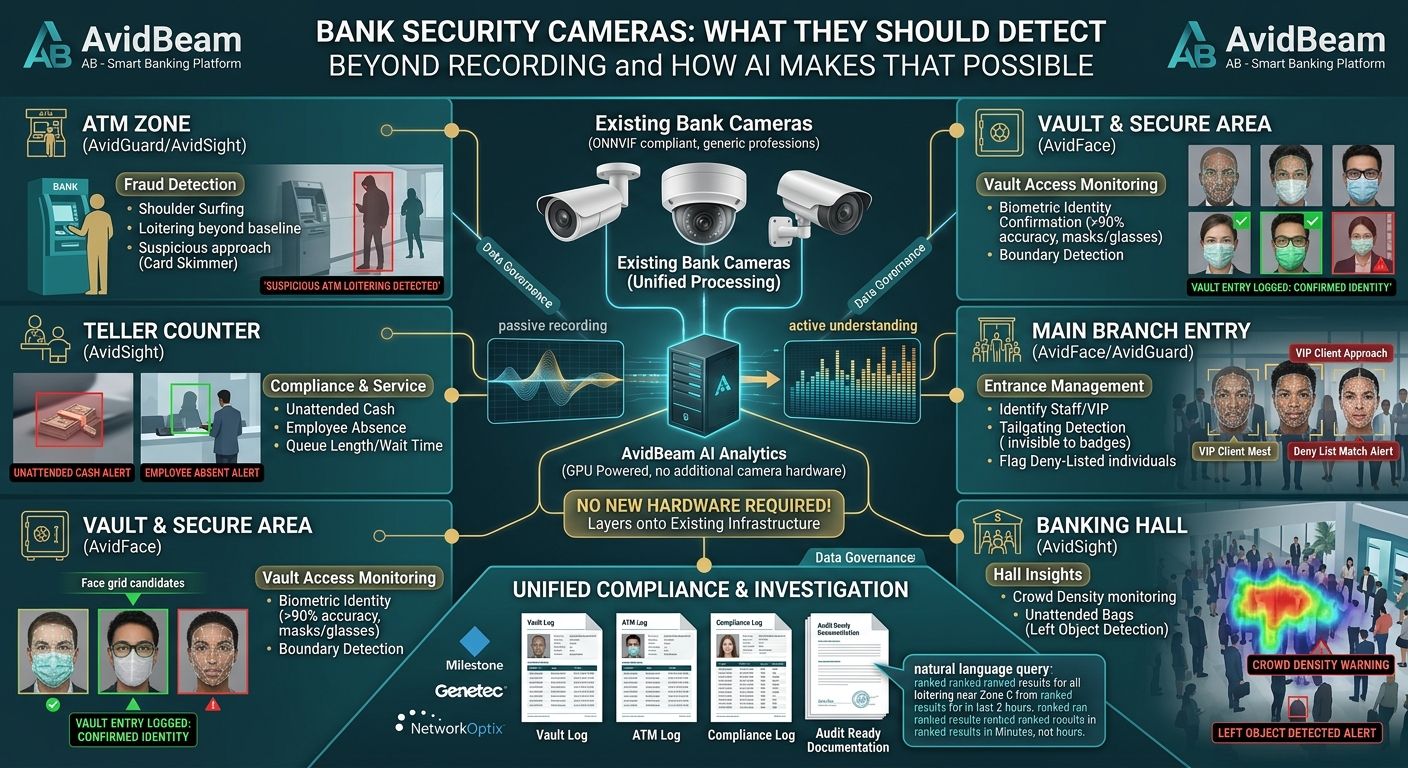
Bank Security Cameras: What They Should Detect Beyond Recording and How AI Makes That Possible
Bank security cameras should do more than record. In a modern branch, they should detect Automated Teller Machine (ATM) fraud attempts before the next customer approaches
Experience AI Video Analytics
on your existing cameras.
Start with a pilot deployment and scale seamlessly as your operational requirements evolve.