Heatmap Software That Runs on Cameras You Already Have and Tells You What Your Space Actually Does
If you are evaluating heatmap software, you probably already know that something about your space is not working the way you expected. Customers are not finding a product zone. A service counter has inconsistent wait times
| What is heatmap software?Heatmap software is a platform that converts movement data from camera feeds or sensors into a color-coded spatial visualization, showing where people go within a monitored area, how long they stay in each zone, and which routes they follow through the space. AI-powered heatmap software extracts this data continuously from existing camera feeds without additional sensor hardware, producing movement density maps, dwell time maps, pathway analysis, and time-segmented occupancy data that inform layout, staffing, and operational decisions. |
If you are evaluating heatmap software, you probably already know that something about your space is not working the way you expected. Customers are not finding a product zone. A service counter has inconsistent wait times. Staff are positioned where traffic is light and absent where it is heavy. The layout made sense on paper but does not produce the results expected in practice.
Heatmap software shows you what is actually happening. It converts the invisible patterns of how people move through your space into a visual record you can act on. Where they go, how long they stay, which zones they skip entirely, which routes they consistently take, and how all of that changes across different times of day.
AvidBeam's AvidSight platform generates heatmap data from Artificial Intelligence (AI) video processing on existing camera feeds. The software produces movement density maps, dwell time maps, pathway analysis, and time-segmented occupancy data continuously without additional sensors, all from the cameras already covering the space.
What Does Heatmap Software Actually Produce?
The specific outputs vary between platforms. Understanding what each output type reveals and what decision it supports helps match the right software to the specific operational question being asked.
Movement Density Maps
A movement density map shows where people went within a space during a measured period. Red and orange zones had the most foot traffic. Blue and green zones had the least. This output answers the question: where are people going?
Movement density alone is not sufficient for most operational decisions. High density could mean a zone that people engage with deeply or a corridor that people walk through on the way to somewhere else. The density map needs to be read alongside dwell time data to distinguish the two.
Dwell Time Maps
A dwell time map shows how long people stayed in each zone on average. This output answers the question: where are people stopping and engaging rather than passing through?
As covered in AvidBeam's analysis of what retail heatmap technology reveals about store performance, the most operationally useful finding often comes from the combination of density and dwell time. A high-density, low-dwell zone is a transit route. A high-density, high-dwell zone is an engagement area. A low-density, high-dwell zone is a hidden engagement point that traffic is not currently finding.
Pathway Analysis
Pathway analysis maps the specific routes people follow through the space from entry to exit. This output reveals bypass patterns: zones that receive no traffic despite their physical location, often because the layout or signage does not direct people toward them.
Pathway analysis is the output that most directly diagnoses why a zone underperforms. High density flowing past a zone without entering it indicates a navigation or visibility problem. Low density reaching the zone at all indicates a flow problem earlier in the customer journey. The intervention required for each is different.
| Want to see what heatmap software reveals on your existing cameras? Send an email to info@avidbeam.com for a free demo on your floor plan. |
Video-Based Heatmap Software vs. Sensor-Based Systems
As covered in AvidBeam's analysis of how surveillance footage generates spatial intelligence, the fundamental difference between video-based heatmap software and sensor-based counting systems is coverage granularity and the range of outputs each produces.
The table below maps the specific differences between sensor-based heatmap systems and video-based heatmap software across the dimensions that determine which is the right choice for a given environment.
| Dimension | Sensor-Based Heatmap | Video-Based Heatmap Software |
|---|---|---|
| Hardware required | Infrared sensors, pressure mats, or Wi-Fi tracking beacons per zone | Any existing ONVIF compliant camera with 2MP minimum resolution; no additional hardware |
| Coverage granularity | Point counts at sensor locations only | Continuous spatial mapping across the full camera-monitored floor plan |
| Dwell time measurement | Not available from most counting sensors | Average dwell time per zone extracted from the same camera feeds |
| Pathway analysis | Not available from point sensors | Full route mapping from entry through zones to exit revealed from camera feeds |
| Demographic data | Not available without dedicated sensors | Age and gender distribution per zone from the same heatmap processing pipeline |
| Installation disruption | Sensor installation per zone; floor or ceiling mounting required | Software deployment only; no hardware installation or floor disruption |
| Cost to expand coverage | New sensor hardware per additional zone | Software configuration extends to cameras already covering new zones |
| Security integration | Separate systems for heatmap and security | Same cameras run heatmap analytics and security detection through one platform |
For most environments with existing camera coverage, video-based heatmap software produces richer spatial intelligence at lower total cost than sensor-based systems, because the hardware required is already installed.
What Outputs Does AvidSight Heatmap Software Produce?
The table below maps every heatmap output AvidSight produces, what the software generates for each, and the specific decision each output supports.
| Heatmap Output | What the Software Produces | What Decision It Supports |
|---|---|---|
| Movement density map | Color-coded overlay showing foot traffic concentration per zone | Identifies hotspots and dead zones across the full monitored floor plan |
| Dwell time map | Average time spent per zone visualized across the floor plan | Distinguishes genuine engagement zones from transit corridors |
| Pathway analysis | Routes people follow from entry through zones to exit | Reveals bypass patterns and navigation logic that drives or prevents zone engagement |
| Time-segmented heatmaps | Same floor plan filtered by hour, day of week, or operational period | Peak shift data; morning and afternoon traffic produce different patterns |
| Zone comparison reports | Side-by-side zone performance across multiple time periods | Pre and post-change measurement; campaign impact; seasonal behavioral shifts |
| Occupancy tracking | Real-time and historical occupancy per zone | Capacity management, staffing alignment, and compliance monitoring |
| Demographic distribution | Age estimation and gender distribution per zone | Customer profiling from existing cameras without dedicated demographic sensors |
| Queue measurement | Queue length and wait time per service position | Staffing alerts and scheduling data from the same cameras running heatmap analytics |
Which Environments Use Heatmap Software?
Heatmap software applies wherever understanding how people use a physical space would improve how that space is designed, staffed, or operated.
- Retail stores and shopping centers: layout optimization, product zone performance measurement, promotional impact tracking, and staffing alignment to observed peak periods
- Banking branches: counter and service position occupancy, waiting area management, and layout decisions based on customer movement through the branch
- Hotels and hospitality: lobby flow analysis, restaurant and outlet occupancy patterns, and service position performance measurement
- Airports and transport hubs: passenger flow monitoring, concession zone performance, and queue and wait time measurement at service points
- Healthcare facilities: waiting area occupancy, patient flow through departments, and staff positioning relative to patient movement patterns
- Corporate offices and facilities: desk and workspace utilization, meeting room occupancy patterns, and cafeteria and common area flow data
- Exhibition centers and museums: exhibit engagement measurement, visitor pathway analysis, and crowd management data for high-attendance events
Does Heatmap Software Require New Cameras or Sensors?
AvidSight generates heatmap data from any Open Network Video Interface Forum (ONVIF) compliant camera with a minimum 2 Megapixel resolution. No additional sensors, beacons, or dedicated people-counting hardware are required. All processing happens on a central server connected to the existing cameras through standard network protocols.
The server infrastructure baseline is 2GB RAM and one virtual core at 2.4 GHz per connected camera. The heatmap software activates through a software deployment on the existing camera network. Consequently, adding heatmap analytics to a space that already has cameras is a software project rather than an installation project.
AvidSight also integrates with AvidGuard's security detection on the same camera feeds. Heatmap analytics and behavioral security alerts run simultaneously through the same platform, so the same cameras that reveal where customers go also flag unusual presence in security-sensitive zones.
FAQ
What is heatmap software?
A platform that converts movement data from camera feeds into spatial visualizations showing where people go, how long they stay, and which routes they follow, producing data that informs layout, staffing, and operational decisions.
What is the difference between video-based and sensor-based heatmap software?
Sensor-based systems count at specific points; video-based software maps continuous spatial movement across the full camera-monitored area, adding dwell time, pathway analysis, and demographic data without additional hardware.
Does heatmap software require new cameras or sensors?
No. AvidSight generates heatmap data from any existing ONVIF compliant camera with 2MP minimum resolution; no sensors or additional hardware installation is required.
What decisions does heatmap software support?
Layout and product placement, staffing schedules aligned to peak periods, promotional effectiveness measurement, service capacity management, and post-change impact measurement for any physical change to a space.
How long does heatmap software need to run before producing useful data?
Useful patterns typically emerge within one to two weeks; run analysis across at least this period and segment by time window before drawing conclusions about individual zones.
Can heatmap software and security monitoring run on the same cameras?
Yes. AvidSight heatmap analytics and AvidGuard behavioral security detection both run through the same AvidBeam platform on the same camera feeds simultaneously.
Which environments benefit most from heatmap software?
Any environment where understanding how people use a physical space would improve layout, staffing, or service decisions: retail, banking, hospitality, healthcare, airports, offices, and exhibition centers.
| Want to see AvidBeam's heatmap software in action?Request a live demo of AvidSight on your existing cameras. Send an email to info@avidbeam.com to schedule a session with the technical team. |
 Article
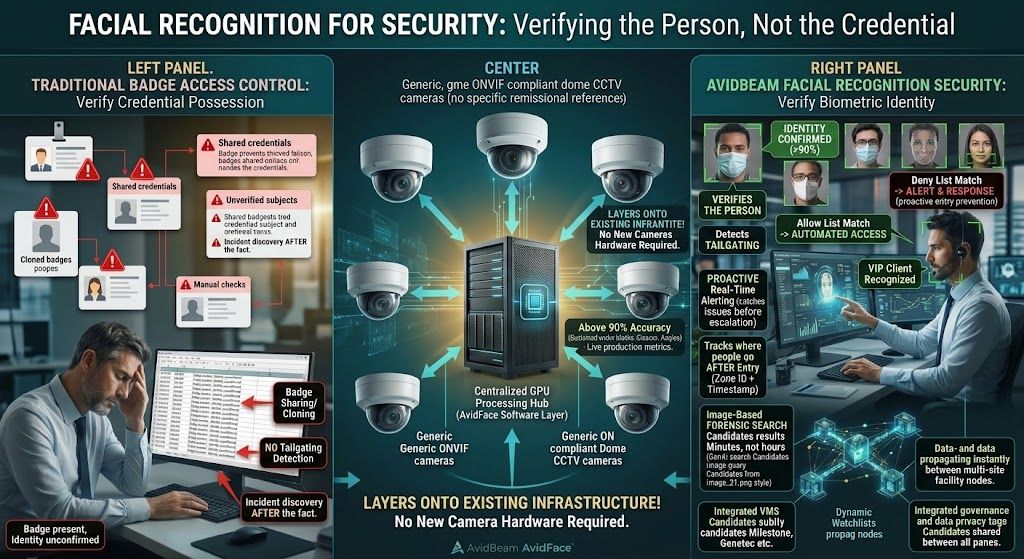
Facial Recognition for Security: What It Catches That Badge Systems Cannot and How It Works on Existing Cameras
Badge-based access control has one fundamental limitation: it verifies that a credential is present, not that the person presenting it is who it says they are. A badge can be cloned, shared, lost, or used by someone it was not issued to
 Article
What Video Analytics Does for Hotels and Resorts Beyond Recording and Why It Matters for Guest Experience
Video analytics for hospitality is the application of AI to hotel and resort camera feeds to improve guest experience, enhance security, and generate operational intelligence simultaneously
 Article
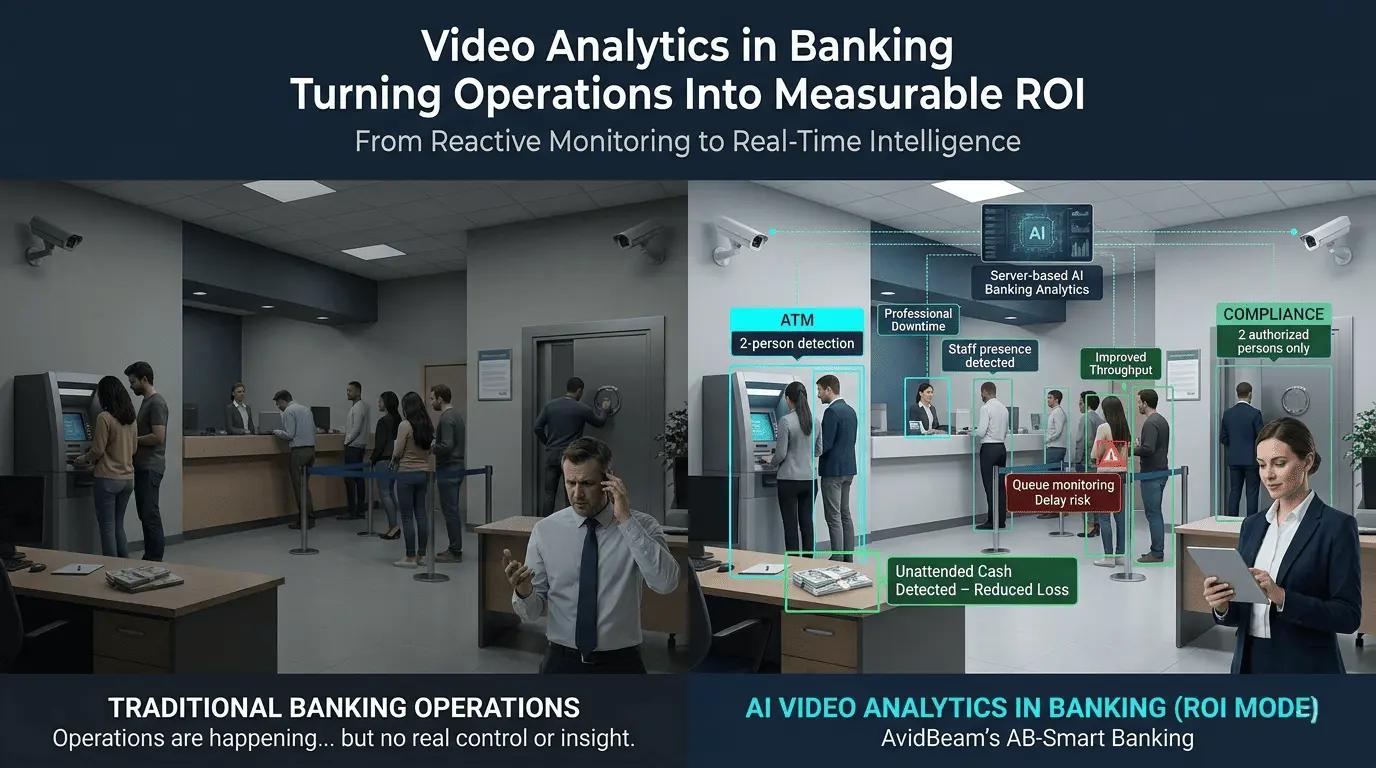
Video Analytics in Banking: What Your Branch Cameras Can Detect Beyond Recording
Video analytics in banking is the application of AI to branch camera feeds to automatically detect fraud patterns, monitor compliance, manage queues, and generate operational intelligence without requiring staff to watch screens continuously
Experience AI Video Analytics
on your existing cameras.
Start with a pilot deployment and scale seamlessly as your operational requirements evolve.