Heatmap Analysis Does Not Show You What People Did. It Shows You What the Space Made Them Do.
A heatmap is the visual summary. The analysis layer behind it processes four simultaneous data streams that each add a distinct dimension to the spatial intelligence picture.
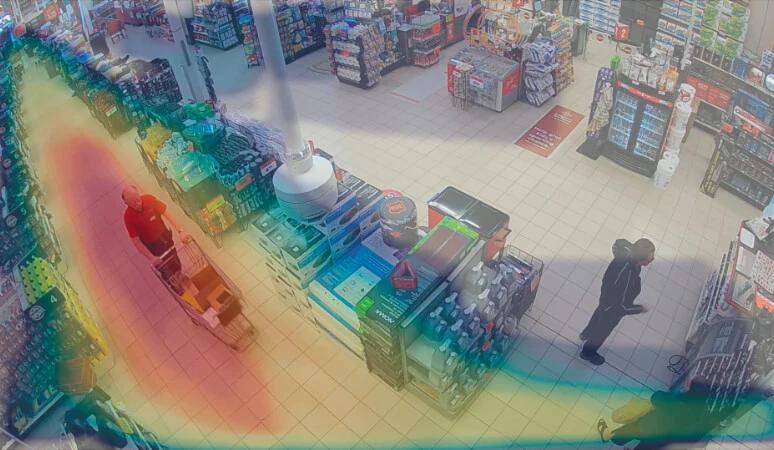
| What is heatmap analysis?Heatmap analysis is the process of interpreting spatial movement density and dwell time data, typically visualized as a color-coded overlay of a floor plan or monitored area, to identify behavioral patterns and their operational implications. It answers questions that transaction data, headcounts, and observation cannot: where people go within a space, how long they stay in specific zones, which areas they systematically avoid, and how those patterns change across time and operational periods. |
Transaction data tells you what people bought. It does not tell you where they went before they bought it, how long they spent in each area, which sections they walked past without stopping, or why a product zone with high foot traffic consistently underperforms on conversion.
Heatmap analysis fills that gap. It extracts spatial behavior from existing camera feeds and converts it into a visual and structured data record of how people actually use a space. Furthermore, it does this continuously rather than through periodic surveys or manual observation, meaning the analysis reflects actual behavior rather than remembered or reported behavior.
AvidBeam's AvidSight platform generates heatmap analysis from Artificial Intelligence (AI) video processing on existing camera infrastructure. The output covers movement density, dwell time, pathway patterns, demographic distribution, and queue performance, all from the cameras already covering the monitored space.
What Heatmap Analysis Actually Measures
A heatmap is the visual summary. The analysis layer behind it processes four simultaneous data streams that each add a distinct dimension to the spatial intelligence picture.
Movement Density
Movement density measures how many individuals occupy each zone across different time windows. The color gradient in the heatmap output directly reflects this: red and orange zones accumulate the most foot traffic; blue and green zones attract the least. However, high density alone is not a complete analysis signal. Density without dwell time data cannot distinguish between a zone that people pass through on the way to somewhere else and a zone where they stop and engage.
Dwell Time
Dwell time measures how long individuals remain in specific zones. This is the analysis dimension that separates zones of genuine engagement from zones of high-traffic transit. A product display with high foot traffic but low dwell time indicates a navigation function: people pass it on the way to something else. The same display with high dwell time indicates active engagement, whether or not that engagement converts to a transaction.
The most operationally significant heatmap analysis finding is often not the hotspot but the combination: a high-traffic, low-dwell zone adjacent to a low-traffic, high-dwell zone reveals a navigation and discovery problem that no transaction report surfaces.
Pathway Analysis
Pathway analysis maps the routes people follow from entry through zones to exit. It reveals bypass patterns: sections that receive no traffic despite their position in the floor plan. It surfaces the actual navigation logic that visitors apply, which frequently differs from the intended logic that the layout was designed around.
Consequently, layout decisions informed by pathway analysis are based on observed behavior rather than category logic or supplier placement frameworks. Furthermore, changes in pathway patterns following layout modifications provide direct evidence of whether the modification produced the intended behavioral change.
Time-Segmented Analysis
Heatmap analysis becomes substantially more useful when filtered by time window. The same physical space produces entirely different movement patterns at different hours of the operating day. Morning traffic concentrates differently from afternoon traffic. Weekday patterns differ from weekend patterns.
Time-segmented heatmap analysis produces peak shift data: the identification of which zones attract the most activity during which time windows. That data feeds staffing schedules, promotional placement timing, and operational resource allocation with verified spatial evidence rather than manager observation.
| To find out how AvidSight's heatmap analysis applies to your facility's existing cameras, send an email to info@avidbeam.com and the team will follow up. |
Reading Heatmap Analysis: Eight Patterns and What They Mean
The operational value of heatmap analysis depends on correctly interpreting the patterns it produces. The table below maps the eight most common heatmap patterns, what each one shows visually, and what the analysis means for operational decisions.
| Pattern Type | What the Heatmap Shows | What the Analysis Means Operationally |
|---|---|---|
| High-density hotspot | Zone consistently shows red or orange concentration | Area attracts sustained engagement; validate product placement or service positioning at that point |
| Dead zone | Zone shows persistent blue or green despite surrounding activity | Floor space underperforming relative to foot traffic available; candidate for repositioning or activation |
| Bypass pattern | Significant traffic flows past a zone without entering | Navigation issue, visibility problem, or category logic failure; not a product demand issue |
| Dwell time spike | Individuals remain in a specific zone significantly longer than adjacent zones | High engagement depth; correlate with conversion data to determine if dwell produces sales |
| Congestion point | Density accumulates in a narrow zone creating flow disruption | Layout or fixture placement is forcing a bottleneck; affects adjacent zone performance |
| Peak shift | Hotspot location changes between morning and afternoon | Time-segmented staffing and product activation opportunities across the operating day |
| Promotional response | Density shifts toward a promotional display during campaign period | Direct measurement of physical campaign impact; compare against pre-campaign baseline |
| Service queue buildup | Density concentrates near a service counter beyond operational norms | Staffing gap or counter layout issue; feeds scheduling decisions with verified data |
Heatmap Analysis Across Decision Domains
Heatmap analysis produces evidence for decisions across four distinct operational domains. Each domain uses different aspects of the spatial data to answer different questions.
Layout and Product Placement
Layout decisions informed by heatmap analysis start from what people actually do in the space rather than what category logic suggests they should do. Dead zone analysis identifies floor space receiving minimal engagement despite available foot traffic, distinguishing a genuine demand absence from a visibility or positioning issue. Bypass pattern analysis identifies specific sections that traffic flows around without entering, indicating a navigation problem rather than a product problem.
Consequently, layout changes recommended after heatmap analysis have a behavioral evidence base. Furthermore, post-change heatmap comparison provides direct measurement of whether the change produced the intended behavioral shift.
Staffing and Scheduling
Time-segmented heatmap analysis generates zone-level peak period data that manual observation cannot replicate consistently. Which zones produce the highest customer concentration? Where does traffic shift during the last hour of trading? Which service areas accumulate queue density that correlates with cart abandonment or service dissatisfaction?
Staffing schedules built on heatmap analysis data reflect verified spatial patterns rather than historical assumptions that may not match current customer behavior. Additionally, the same data identifies zones where staff presence is consistently absent during peak customer concentration, surfacing coverage gaps before they affect service quality.
Marketing and Campaign Measurement
Heatmap analysis provides the only direct measurement of physical store impact from marketing investment. Sales uplift from a campaign is measurable from transaction data. Whether that uplift came from increased foot traffic to a specific promotional zone, or from the same traffic converting at a higher rate, is only visible in the spatial data.
Pre and post-campaign heatmap comparison shows whether the campaign produced a measurable traffic shift toward the promoted zone. Furthermore, promotional placement analysis identifies which in-store display positions produce the strongest density response across different customer journey stages.
Security Zone Analysis
Heatmap analysis serves a security function when integrated with AvidGuard's behavioral detection layer on the same camera network. Anomalous density patterns in security-sensitive areas, such as clustering near restricted zone boundaries or sustained individual presence near high-value assets, contribute to the behavioral baseline that AvidGuard's loitering and intrusion detection models use to calibrate zone-specific alerts.
Additionally, a security team investigating an incident can cross-reference heatmap data for the relevant zone against the behavioral baseline to determine whether the movement pattern preceding the event was genuinely anomalous or consistent with normal activity for that time window.
Without Heatmap Analysis vs. AvidSight Heatmap Analysis — Comparison
The table below sets out where AvidSight's heatmap analysis changes the evidence base available for operational decisions across the areas where the absence of spatial data most consistently produces a cost.
| Decision Area | Without Heatmap Analysis | With AvidSight Heatmap Analysis |
|---|---|---|
| Spatial behavior data | Not available; transaction data shows what sold, not where people went | Full floor plan coverage showing where people go, how long they stay, and what they avoid |
| Dead zone identification | Not detectable from sales or footfall counts | Heatmap analysis reveals underperforming areas despite available foot traffic |
| Bypass pattern detection | Not visible from aggregate traffic counts | Specific zones shown to receive traffic that does not convert to entry or dwell |
| Time-segmented patterns | Historical sales data; no spatial breakdown by time window | Hour-by-hour density per zone; peak shift identification for targeted staffing |
| Promotional impact | Sales uplift assumed; physical store traffic impact unmeasured | Observed density shift toward promotion zone during campaign period vs. baseline |
| Campaign ROI measurement | Not available from store-level sales data alone | Pre and post-campaign heatmap comparison reveals physical engagement change per zone |
| Staffing alignment | Manager observation; inconsistent peak identification | Verified peak period data per zone feeds scheduling decisions with observed evidence |
| Hardware requirement | People counters or sensors often needed | Generated from existing cameras; no additional hardware required |
Transaction data tells you what sold. Heatmap analysis tells you everything that happened in the space before the sale, and everything that happened in the zones where no sale followed despite the traffic being there.
Infrastructure and Deployment
AvidSight generates heatmap analysis from any Open Network Video Interface Forum (ONVIF) compliant camera via standard network protocols. All analysis processing runs centrally on dedicated server infrastructure. Therefore, no specialized sensors or people-counting hardware are required.
The infrastructure baseline per camera processed:
- 2GB RAM minimum; one virtual core at 2.4 GHz minimum
- Multiple Graphics Processing Unit (GPU) configurations supported for higher-density deployments
- Camera resolution: 2MP up to 4K; lens focal length 3mm to 25mm
Video Management System (VMS) integration covers Milestone, NetworkOptix, and Genetec platforms. Deployment options include on-premise, private cloud, public cloud, and hybrid. For multi-site organizations, all locations feed into a single management interface, enabling cross-site heatmap comparison and unified analysis without navigating separate systems per location.
FAQ
What is heatmap analysis?
The interpretation of spatial movement density and dwell time data to identify behavioral patterns, distinguishing hotspots, dead zones, bypass patterns, and peak shifts that transaction data and observation cannot reveal.
What does heatmap analysis reveal that sales data cannot?
Where people go within a space, how long they stay in each zone, which areas they avoid despite available foot traffic, and how movement patterns change across different hours and operational periods.
How does AvidSight generate heatmap analysis?
AvidSight processes continuous camera feeds through AI video analysis models that extract movement paths, dwell time, and density patterns, converting raw footage into structured spatial intelligence updated in real time.
Does heatmap analysis require new cameras or sensors?
No. AvidSight generates heatmap analysis from any existing ONVIF compliant camera; the minimum is 2GB RAM and one virtual core at 2.4 GHz per camera on the processing server.
What is a dead zone in heatmap analysis?
A floor area that consistently shows minimal density despite proximity to high-traffic zones, indicating a visibility, navigation, or positioning issue rather than an absence of demand.
Can heatmap analysis measure the impact of a marketing campaign?
Yes. Pre and post-campaign heatmap comparison shows whether a campaign produced a measurable traffic shift toward the promoted zone, providing direct physical store impact measurement.
Can heatmap analysis and security monitoring run on the same cameras?
Yes. AvidSight heatmap analysis and AvidGuard behavioral detection both run on the same camera feeds through the same platform, with outputs accessible in one unified management interface.
| Want to see heatmap analysis in action?Request a live demo of AvidBeam's AvidSight platform and see how heatmap analysis applies to your facility's existing cameras. Send an email to info@avidbeam.com to schedule a session with the technical team. |
 Article
Facial Recognition for Security: What It Catches That Badge Systems Cannot and How It Works on Existing Cameras
Badge-based access control has one fundamental limitation: it verifies that a credential is present, not that the person presenting it is who it says they are. A badge can be cloned, shared, lost, or used by someone it was not issued to
 Article
What Video Analytics Does for Hotels and Resorts Beyond Recording and Why It Matters for Guest Experience
Video analytics for hospitality is the application of AI to hotel and resort camera feeds to improve guest experience, enhance security, and generate operational intelligence simultaneously
 Article
Video Analytics in Banking: What Your Branch Cameras Can Detect Beyond Recording
Video analytics in banking is the application of AI to branch camera feeds to automatically detect fraud patterns, monitor compliance, manage queues, and generate operational intelligence without requiring staff to watch screens continuously
Experience AI Video Analytics
on your existing cameras.
Start with a pilot deployment and scale seamlessly as your operational requirements evolve.