Transaction Data Tells You What Sold. Retail Analytics Software Tells You Why.
- June 9, 2026
- Posted by:
- Category: News
Retail transaction data answers one question reliably: what did customers buy? It does not answer where they went before they bought it, how long they spent considering it, which areas of the store they avoided entirely, or why the promotional display in Zone 4 drove no conversion despite sitting in a high-footfall corridor. Those questions require a different data source — one built on observed behavior rather than completed purchases.
Retail analytics software built on AI video analysis fills that gap by converting the surveillance cameras already installed in a store into a continuous source of behavioral intelligence. Customer movement paths, zone dwell times, demographic distributions, queue lengths, campaign-period traffic shifts, and security anomalies — all extracted from existing camera feeds, without specialized retail hardware, and fed into a management interface that operations teams can act on directly.
AvidBeam’s AvidSight platform delivers this across retail environments of all sizes, from single-format stores through to multi-site retail chains, running on the camera infrastructure organizations already have in place.
What Retail Analytics Software Actually Measures
The value of retail analytics software is determined by the gap between what it measures and what transaction data already provides. Transaction records cover what was sold, when, and at what price point. They do not cover the behavioral layer that precedes every purchase decision — and it is that layer where layout, staffing, merchandising, and promotional placement decisions either compound or waste floor space investment.
The behavioral data that retail analytics software produces from in-store camera feeds:
- Movement paths: the routes customers actually follow from entrance through product zones to checkout, independent of what they ultimately buy
- Dwell time: how long individuals stay in specific zones; the distinction between a zone customers pass through and one where they stop and engage
- Density patterns: how many people occupy a zone across different time windows; which hours produce peak concentration in specific departments
- Demographic distribution: age estimation and gender ratio across store sections; who is actually in each zone, not who the intended customer segment is
- Hotspots and dead zones: which areas consistently attract sustained engagement and which receive minimal foot traffic despite proximity to active sections
- Conversion indicators: stops, engagement signals, and dwell patterns near product displays that suggest purchase consideration before a transaction occurs
Together, those data layers produce a store performance picture that sales data alone cannot replicate — and one that changes the quality of decisions available to operations managers, category directors, and marketing teams simultaneously.
| To find out how AvidSight’s retail analytics software applies to your store format and existing camera infrastructure, send an email to [email protected], and the team will follow up with a technical assessment. |
How AvidSight Works: AI Video Analysis on Existing Cameras
AvidSight is built on a server-based AI video analysis architecture, which means the analytics processing runs centrally on dedicated infrastructure, not at the camera level. That distinction matters for retail deployments because it determines accuracy consistency across store environments, the ease of extending coverage to new locations, and whether the software requires specialized hardware investment or runs on what is already installed.
Server-Based Architecture
Standard surveillance cameras capture footage across the store floor continuously. Most retail organizations already have this infrastructure in place. AvidSight’s retail analytics software connects to those existing cameras via ONVIF-compliant network protocols, processes all video feeds through centralized AI models, and produces behavioral intelligence outputs without requiring camera replacement or specialized retail sensor installation.
The operational advantages of that architecture for multi-site retailers:
- A flagship store running on-premise servers and a smaller format location on cloud infrastructure can both run AvidSight through the same platform without a standardized hardware baseline
- New detection capabilities and updated AI models are deployed through software across all connected stores simultaneously; no per-location hardware intervention
- All analytics data from all sites feeds into a single management interface — cross-location performance comparison without navigating separate systems per store
From Raw Footage to Business Intelligence
AvidSight’s AI video analysis processes continuous camera feeds through computer vision algorithms and deep learning models that extract specific behavioral signals from what the cameras see. The system identifies individual customers as they move through the store, tracks their paths across zones, measures how long they spend in each area, counts entries and exits, estimates age and gender distributions from visual attributes, and generates the structured data outputs that feed into heatmaps, pathway charts, demographic reports, and queue performance dashboards.
AvidGenAI extends this further by enabling operations staff to query the analytics platform in natural language — a store manager can ask what is the busiest zone is currently, or whether the staff is present in their places, and receive a direct answer without pulling separate reports for each metric.
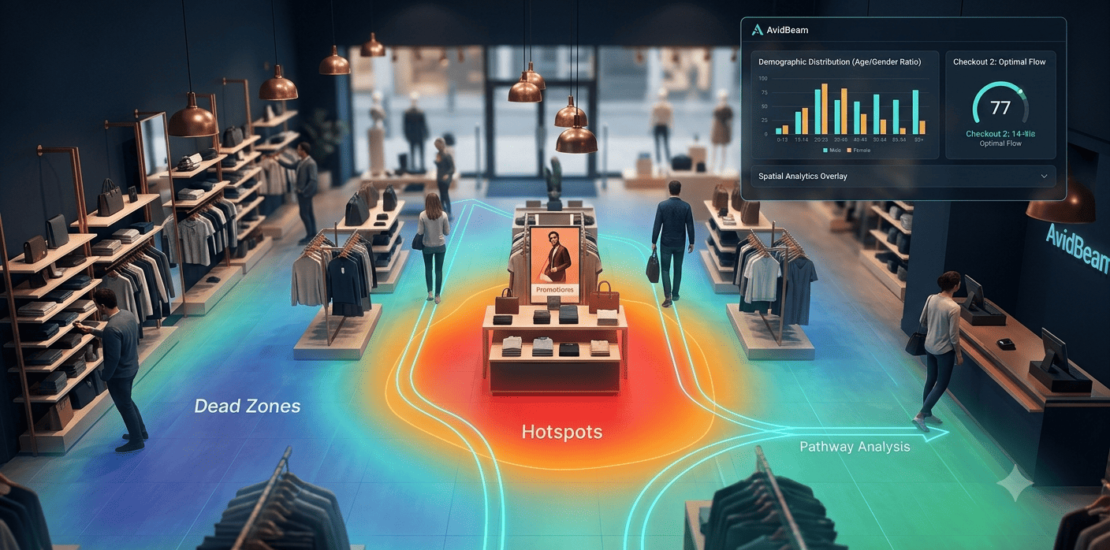
Heatmap Analysis — The Spatial Intelligence Layer
The heatmap is the most immediately readable output that retail analytics software produces — and the one that tends to change layout and merchandising decisions fastest because it makes the invisible visible. Store managers who have run on transaction data and supplier category frameworks for years often see, for the first time, where customers actually go and where they do not go at all.
Reading a Heatmap Operationally
AvidSight’s heatmap analysis generates a color-coded spatial overlay of the store floor plan, updated continuously from camera feed data:
- Red and orange zones — high-activity areas where foot traffic concentrates or dwell time runs consistently long; the areas that customers spend time in, regardless of whether that time converts to a purchase
- Blue and green zones — low-activity areas where customers move through quickly or avoid altogether; floor space that is not earning the investment it represents
The heatmap alone answers the foundational question that transaction data cannot: where are people spending time before every purchase decision, and where are they not spending time at all? That distinction changes what questions get asked about product placement, promotional positioning, and floor plan logic.
From Heatmap to Layout Decision
Heatmap data sitting in a dashboard produces no operational return. The value comes from connecting what the heatmap reveals to decisions that get tested and measured. AvidSight’s retail analytics software supports that workflow through several specific insight types that heatmap analysis surfaces:
- Dead zones: floor space receiving minimal engagement despite proximity to active sections; candidates for repositioning rather than restocking
- Congestion points: narrow aisles, obstructive display configurations, or checkout layouts that slow customer flow and push up abandonment risk in adjacent areas
- High-engagement zones: areas where dwell time runs consistently high but conversion does not follow; candidates for product mix review rather than location change
- Bypass patterns: sections that customers walk past without entering, even when the category logic suggests they should be a natural stop on the customer route
- Promotional display effectiveness: which display positions receive genuine engagement versus which ones draw foot traffic without customers stopping to interact
Customer Behavior Analytics
Heatmaps provide the spatial picture. Customer behavior analytics provides the sequential picture — what customers do across time and across the store, not just where density concentrates. AvidSight’s retail analytics software generates three behavioral data layers that operations teams use across different decision workflows.
Pathway Analysis and Movement Patterns
AvidSight maps the routes customers actually follow from the entrance through product zones to the checkout — independent of what they ultimately purchase. That route data reveals where the intended floor plan logic holds and where customers diverge from it. A category placed on the assumption that customers pass through Zone 3 on their way to Zone 7 shows up in pathway analysis as either confirmed or contradicted by observed behavior.
Access density analysis extends this further: volume data per zone, segmented by time of day, shows which hours produce peak movement in specific departments. That time-segmented data feeds staffing schedules and promotional timing decisions with verified traffic patterns rather than historical assumptions.
Dwell Time and Zone Engagement
Visitor flow data shows where customers go. Dwell time data shows where they stop. The distinction between a zone customers pass through and a zone where they stop and engage is what separates genuine interest from route-following, and it is the distinction that determines whether a product placement decision is working or whether the display is attracting traffic without generating consideration.
AvidSight measures zone-level engagement duration continuously, producing dwell time metrics that cross-reference with density and pathway data to identify which areas are genuinely holding customer attention and which are receiving footfall without a conversion signal.
Access Density and Rush Hour Intelligence
AvidSight’s access density analysis measures visitor volume across store zones segmented by time of day — identifying store rush hours, most crowded sections, and the hours during which customer-to-staff ratios drop in high-traffic departments. That data feeds staffing schedules aligned to verified peak periods rather than historical norms, which means staff are present in the right zones at the right times rather than distributed according to patterns that may no longer reflect actual customer flow.
Traffic forecasting extends the density analysis forward: historical pattern analysis projects future footfall by hour, day, and season, which supports proactive staffing, inventory, and layout planning before peak periods arrive rather than in response to them.
Demographic Analysis and Campaign Measurement
Two of the most strategically valuable outputs that retail analytics software produces are also the ones most difficult to obtain from other data sources: verified demographic distribution across the store’s actual visitor population, and direct measurement of how marketing activity affects physical store traffic. Both come from the same camera feeds as every other AvidSight output.
Visitor Demographics
AvidSight’s AI video analysis estimates age distribution and gender ratio from camera feeds across store sections — producing demographic data from the full visitor population rather than the partial, self-selected sample that loyalty program data provides. The data covers which demographic groups spend time in which zones, how that distribution shifts across different hours and days, and how the demographic profile of each section compares to the intended target audience for the products placed there.
That data enables personalized zone-level merchandising decisions, marketing strategies designed around the demographic composition of each area, and campaign performance validation against the actual audience the campaign reached inside the store — not the audience it was designed to reach.
Advertising Campaign Correlation
AvidSight correlates customer visit patterns against campaign periods — cross-referencing traffic data with marketing activity to measure the physical store impact of campaigns with observed footfall data rather than assumed conversion lift. A campaign that drove a measurable increase in traffic to a specific zone during the promotional period shows up directly in AvidSight’s access density data. A campaign that produced sales uplift without a corresponding traffic increase in the target zone raises a different question about where the conversion came from.
That correlation capability closes the measurement gap that has made it difficult for retail marketing teams to connect campaign investment directly to in-store behavioral response — independently of what the sales data shows after the fact.
| For a technical walkthrough of AvidSight’s retail analytics software capabilities matched to your store format, send an email to [email protected] and the team will follow up directly. |
Queue Performance and Checkout Intelligence
Checkout queue performance is the retail analytics data point with the most direct connection to cart abandonment — and one of the most undermonitored operational metrics in stores that run on transaction data alone. A customer who abandons a cart at the checkout does not generate a transaction record. The abandonment is invisible unless the queue length and wait time data that preceded it is being captured continuously.
AvidSight’s cashier queue performance module tracks wait time, queue length, and bottleneck formation per checkout point as a function of time of day. The retail analytics software generates:
- Real-time queue length per checkout point — visible to floor managers without requiring them to physically monitor each lane
- Wait time tracking across the operating day — which hours produce queue lengths that correlate with cart abandonment risk
- Bottleneck identification before congestion becomes operationally disruptive — alerts that allow staffing response before customers reach the abandonment threshold
- Historical queue performance patterns by day and season — feeds checkout staffing schedules with verified peak period data
That data connects directly to staffing decisions: where customer-to-staff ratios drop during high-traffic periods, when additional checkout lanes need to open, and which hours consistently produce queue lengths that push abandonment risk beyond the acceptable threshold.
Security and Compliance on the Same Platform
AvidSight runs its behavioral analytics and security monitoring on the same camera infrastructure and the same platform — which means retail organizations do not need a separate surveillance system alongside the analytics layer. The security outputs run continuously in parallel with the commercial intelligence outputs, through the same server-based processing architecture.
Anomaly Detection
AvidSight’s anomaly detection capability monitors for behavioral deviations from the learned baseline for each zone — identifying loitering, vandalism, unattended items, potential theft, and unusual behavioral patterns that deviate from normal store activity. When the AI video analysis captures a suspicious behavior pattern, security personnel receive an immediate alert with camera source, timestamp, and location data — enabling rapid threat mitigation before escalation rather than after a loss has occurred.
Blacklisted shoplifter recognition extends this further: AvidSight integrates with AvidFace to identify previously flagged individuals at store entry points, generating alerts before the individual reaches the sales floor rather than during or after a theft event.
Health Compliance Detection
AvidSight monitors health and safety compliance within the retail environment through the same camera feeds that generate commercial analytics. The system analyzes visitor and staff behavior to identify non-compliance with health guidelines — face mask usage, social distancing patterns, and visible compliance indicators — generating alerts when the analytics layer surfaces violations that require a management response.
Full Retail Analytics Software Capability Breakdown
The table below maps every capability AvidSight’s retail analytics software delivers, what it measures, and the operational output each one produces for store management teams.
| Capability | What It Measures | Operational Output |
|---|---|---|
| Heatmap analysis | Spatial overlay of customer movement and dwell time across the store floor plan | Identifies hotspots, dead zones, and bypass patterns — evidence base for layout and merchandising decisions |
| Visitor flow and distribution | Entry/exit counts across daily, weekly, and monthly windows with unique visitor identification | Eliminates duplicate counts; surfaces peak traffic periods for staffing and scheduling alignment |
| Customer pathway analysis | Route mapping from entrance through product zones to checkout | Reveals where intended floor plan logic diverges from actual customer movement |
| Dwell time measurement | Duration metrics per zone showing how long customers engage with each area | Separates zones where customers pass through from zones where they stop and engage |
| Access density analysis | Volume data per zone segmented by time of day | Identifies rush hours per section — feeds staffing schedules and promotional timing |
| Demographic analysis | Age estimation distribution and gender ratio per zone across the store | Enables targeted merchandising decisions and campaign performance validation by audience segment |
| Traffic forecasting | Historical pattern analysis projecting future footfall by hour, day, and season | Supports proactive staffing, inventory, and layout planning before peak periods arrive |
| Cashier queue performance | Wait time monitoring, queue length tracking, and bottleneck identification per checkout point | Surfaces congestion before it drives cart abandonment — enables real-time staffing response |
| Advertising campaign correlation | Customer visit patterns cross-referenced against campaign periods | Measures physical store impact of marketing activity with observed traffic data, not assumed conversions |
| Anomaly detection | Real-time alerts for loitering, vandalism, unattended items, and suspicious behavioral patterns | Security layer running on the same camera feeds as the analytics layer — no separate infrastructure |
| Health compliance detection | Monitoring of face mask usage, social distancing adherence, and compliance patterns | Automated compliance verification without dedicated compliance staff at every monitored zone |
Without vs. With Retail Analytics Software Comparison
The table below sets out where AvidSight’s retail analytics software changes the evidence base available for retail decisions, across the specific decision areas where the absence of behavioral data produces the most consistent operational cost.
| Decision Area | Without Retail Analytics Software | With AvidBeam AvidSight |
|---|---|---|
| Customer behavior data | Transaction records only — what sold, not why | Observed movement, dwell time, pathway, and engagement data from existing cameras |
| Layout decisions | Supplier agreements and category logic — no behavioral input | Heatmap and pathway data showing actual customer routes independent of purchase records |
| Staffing alignment | Historical sales data and manager intuition | Time-segmented access density and queue performance data; schedules built on verified peak periods |
| Demographic insight | Loyalty program data — partial, self-selected sample only | Age and gender distribution per zone across the full visitor population from camera feeds |
| Campaign measurement | Assumed footfall lift from sales uplift; correlation only | Direct traffic data cross-referenced against campaign periods — observed visit patterns, not inferred |
| Queue management | Complaints and manager observation | Real-time queue length and wait time data per checkout point; alerts before congestion drives abandonment |
| Dead zone identification | Not detectable from transaction data alone | Heatmap surfaces floor space receiving minimal engagement despite proximity to active sections |
| Security integration | Separate CCTV system; no behavioral analytics layer | Anomaly detection running on the same camera feeds as the analytics layer — unified platform |
| Hardware requirement | Often requires specialized retail sensors | Layers onto existing surveillance cameras; no specialized retail hardware investment |
Transaction data tells you what sold. AvidSight’s retail analytics software tells you everything that happened in the store before the sale — and everything that happened in the sections where no sale followed despite the traffic being there.
Infrastructure and Deployment
AvidSight connects to the surveillance cameras organizations already have in place. No specialized retail hardware sensors required. No camera replacement for ONVIF-compliant installations. The retail analytics software runs as a server-based layer on top of existing camera infrastructure, with the analytics processing handled centrally rather than at individual camera points.
The infrastructure baseline per camera processed:
- 2GB RAM minimum; one virtual core at 2.4 GHz minimum per camera
- Multiple GPU configurations supported for higher-density store deployments
- Camera resolution: 2MP up to 4K; lens focal length 3mm to 25mm
- Pitch -15° to +15°; roll -180° to +180°; yaw -15° to +15°
VMS integration covers Milestone, NetworkOptix, and Genetec platforms. Deployment options — on-premise, private cloud, public cloud, or hybrid — are configurable based on data governance requirements and the infrastructure profile of each store location in the portfolio.
For multi-site retailers, the same retail analytics software platform covers all store locations through a unified management interface — cross-location performance comparison, unified demographic reporting, and centralized anomaly alert management without navigating separate systems per store.
Frequently Asked Questions
How does retail analytics software differ from POS analytics?
POS analytics covers what sold; retail analytics software covers what happened before the sale — where customers went, how long they stayed, which areas they avoided, and which displays generated engagement before or instead of a purchase.
What demographic data does AvidSight produce?
Age estimation distribution and gender ratio per zone across the store's full visitor population, extracted from camera feeds rather than loyalty data, covering every customer regardless of program enrollment.